
With exploits, attacks, and hackers using PowerShell more and more, it’s critical to know when powershell.exe is running on a system and what commands run from within it. Windows Security logs can tell you that PowerShell.exe has been created, but most of the time will show you little else of what runs within it. That’s why it’s important to assess PowerShell logging to understand what is happening once the shell launches.
What is PowerShell?
PowerShell has been included by default since Windows 7 and Windows Server 2008 R2 and is now used widely around the world. A lot of system administrators use the highly versatile scripting language to automate and improve manual processes across their whole environment. Unfortunately, because PowerShell is available on most virtual machines, it is attackers go-to choice for distributing malware code and other malware activities.
How do I collect PowerShell logs?
The first stage of getting PowerShell logs into your security information and event management (SIEM), is to ensure that they are generated first! By default, PowerShell does not log anything, and it must be enabled. This guide provides guidance on deploying logging via the via the Group Policy Objects (GPO), so it can be pushed out via your Active Directory.
Step 1: Create the Group Policy Configuration
For the purposes of this guide, we will look at creating a new GPO, however, these settings can also be added to existing GPOs that you may have in your environment.
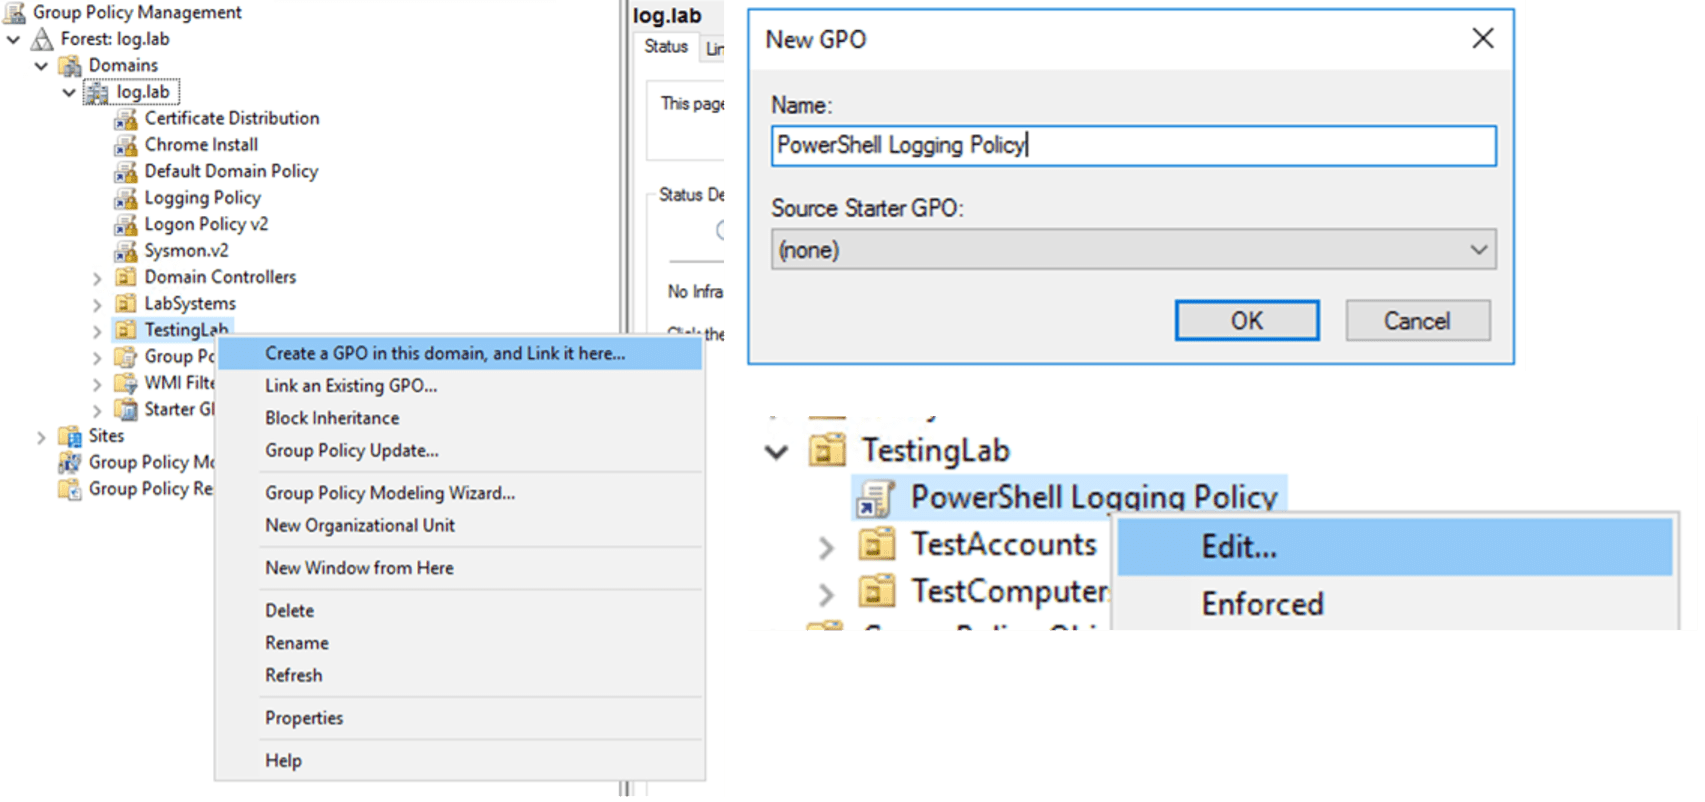
Open the Group Policy Management from Administrative Tools (this would either be on your Domain Controller, or on a system that you have installed the Remote Administration Tools (RAT) Feature within Windows) and choose the Organizational Unit (OU) to apply it to, right click and “Create a GPO in this domain, and Link it here…”, provide with a suitable name to match your internal naming conventions, then right click and Edit the policy. This will open the Group Policy Management Editor, allowing us to modify the settings.
Under Computer Configuration > Policies > Administrative Settings > Windows Components > Windows PowerShell you will find the settings for enabling logging, as seen in Figure 2.
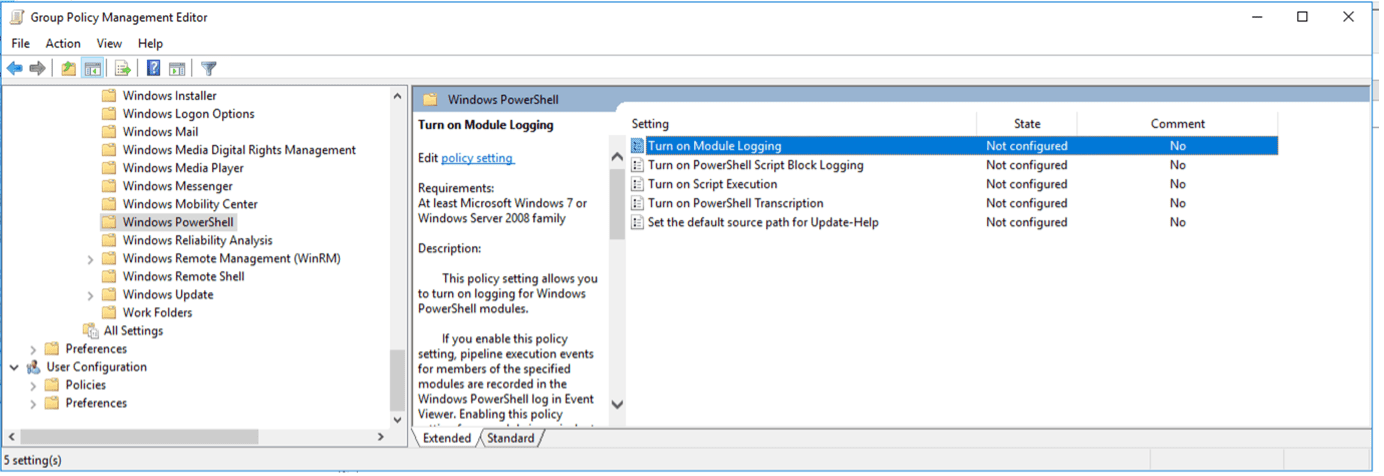
There are two main areas to focus on for PowerShell logging to the SIEM: “Turn on Module Logging” and “Turn on PowerShell Script Block Logging.” These two will both log PowerShell actions, however, are slightly different in what they log.
Module Logging
Module Logging occurs when PowerShell logs the pipeline execution details as it executes commands, including any of the variable initialization and command invocations You can filter to only include certain PowerShell Modules. For example, you could limit the PowerShell logging to only apply to certain modules (can be found from the PowerShell commands Get-Module -ListAvailable). So, if you enabled Module Logging for the module NetAdapter, you would be receiving logs for things like Disable-NetAdapter, but not for Get-ChildItem, as this would be under the Management module.
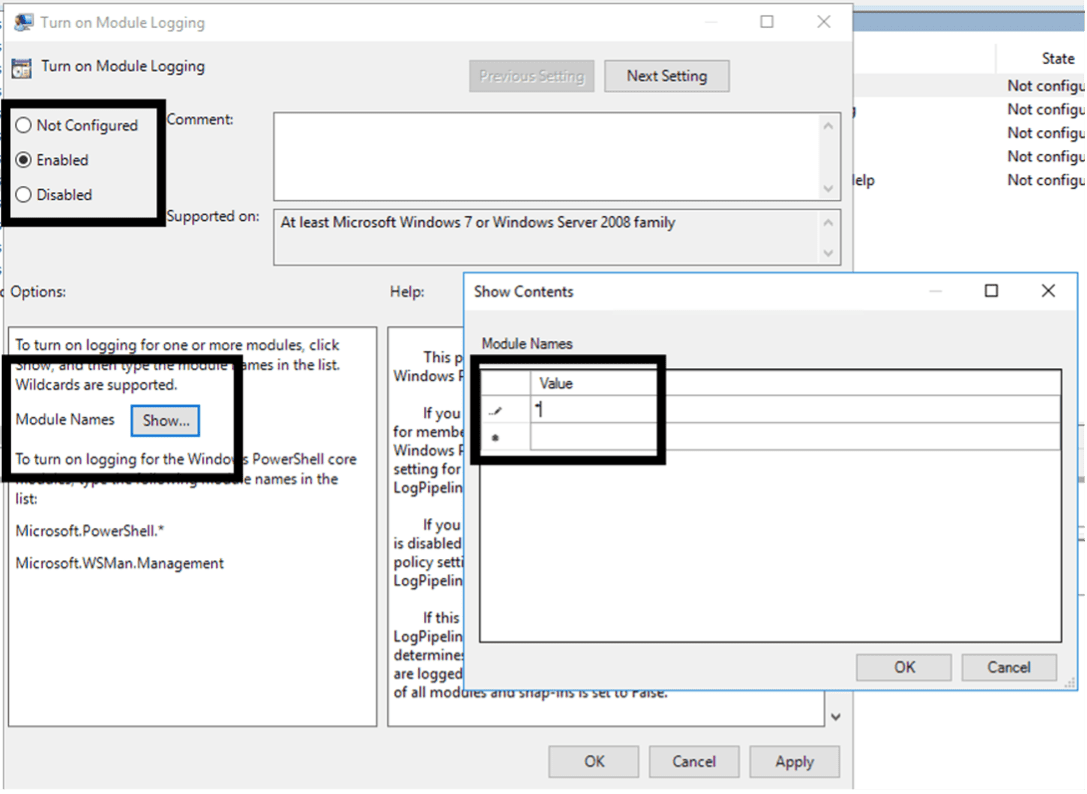
Here are steps to enable the Module Logging:
- Double Click on “Turn on Module Logging” within the Group Policy Management Editor
- Change the configuration to select “Enabled”
- This enables the Options configuration below, select the “Show…” button
- In the popup window, it has a table to enter the Module Names to monitor. Add an asterisk (*) to the first line, click “OK: and then “OK” again to save
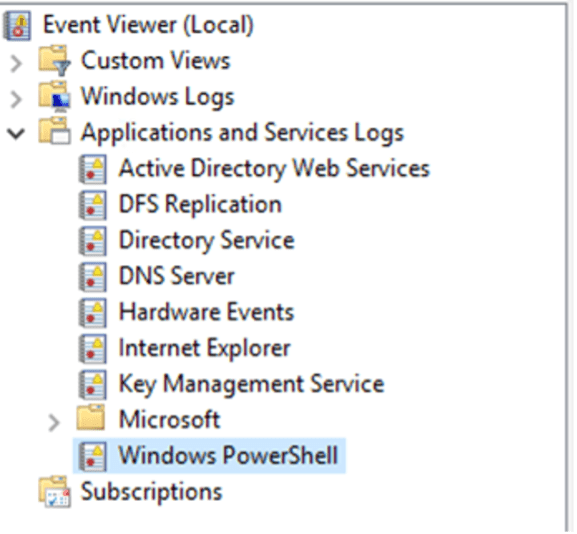
This will start to log PowerShell commands into the Windows PowerShell Event Log found under the Application and Services Logs folder within the Event Viewer. The Full Name for this log, which is needed when onboarding the logs within LogRhythm is “Windows PowerShell.”
This will show commands executed; however, it may miss information that is within a script or larger command block.
Script Block Logging
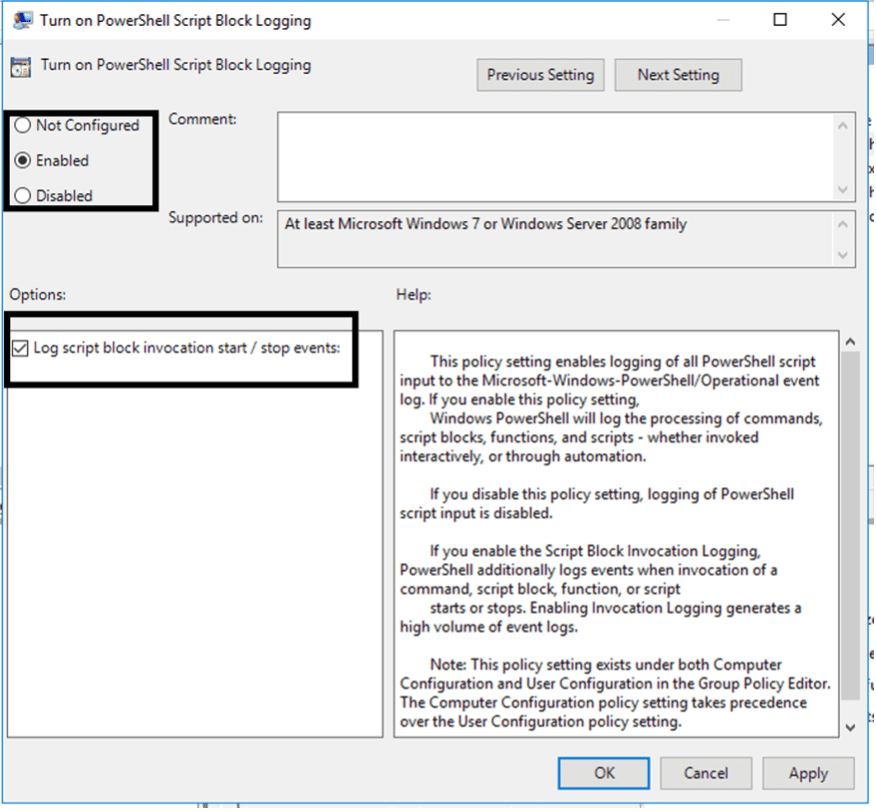
The other PowerShell logging configuration that we will look at is the Script Block Logging. This is different from the Module Logging in that this will monitor everything that PowerShell does, even when executed within scripts or blocks of code. This is enabled in the same Group Policy location as Module Logging but is under the “Turn on PowerShell Script Block Logging.” Also enabling the “Log script block invocation start / stop events” option will additionally log when invocation of a command, function, script or script block starts or stops. It can increase log volume but will ensure that all activities are captured within the logs.
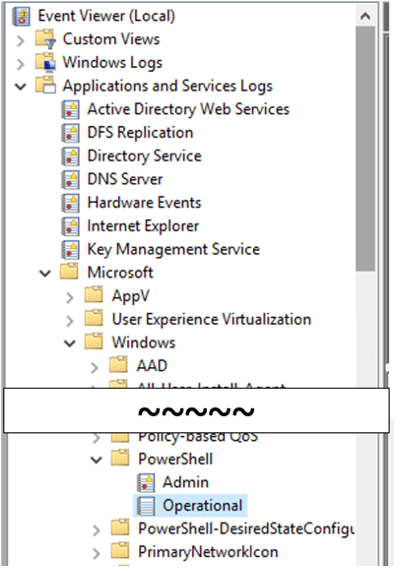
The location of the Script Block logging differs slightly from the PowerShell Module logging. Although it is still stored in the Windows Event Logs, it is stored under Applications and Services Logs > Microsoft > Windows > PowerShell > Operational.
The full name for this Event Log is “Microsoft-Windows-PowerShell/Operational” (this can be found by right-click > Properties). This will be used in LogRhythm for configuring log collection.
Step 2: Onboarding PowerShell logs into LogRhythm SIEM
Now that logs are generating, we need to get these logs into LogRhythm to work with them. There are a few ways to collect the logs, as well as a few ways to configure within LogRhythm to add these logs.
Windows Event Log Forwarding
Built into Windows base image is the Windows Event Forwarding (WEF) feature, which allows for logs to be sent from the endpoint to a central collector system, where the LogRhythm agent can then collect logs centrally. This is all configured via Group Policy, and a guide for collecting logs via WEF is available on our Community (account required). This guide does talk about Application, System, and Security logs; however, this can easily be adapted for PowerShell logs by changing the “By Log” section to PowerShell and PowerShell Operational. This would then allow for both of the PowerShell Event Logs to be forwarded and collected as one Log Source from your centralized Event Collector.
Windows Event Log Collection
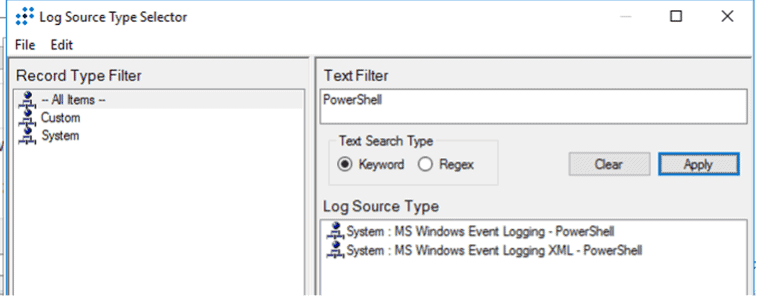
Typically, within LogRhythm Deployments, the Application, System, and Security logs are collected directly from Windows Servers via direct Windows Event Collection (WEC). This is where the LogRhythm SysMon Agent or Collector will query and pull the logs from Windows servers into the Agent and then push these logs into the LogRhythm Data Processor. This is great for systems that are always online and available, however, may be trickier when there are higher turnover of systems and devices that move networks, such as user laptops or desktops. It is easy to add PowerShell to be collected via WEC, but it may be better to only apply this approach to servers and those systems that are static and always online. With this approach you need to ensure that both the Windows PowerShell (Module Logging) and the Windows PowerShell Operational (Script Block Logging) are collected, as they reside in separate event logs within Windows. Although it requires two separate log sources to collect the logs, you can use the same Log Source Type for this, as the PowerShell Log Source has the MPE rules for both log formats. There is currently an ongoing project to move Windows Event Logging to XML based, however, this is for storage and performance improvements, rather than the content since the raw data inside the logs are the same – it’s just the way it’s collected that is streamlined.
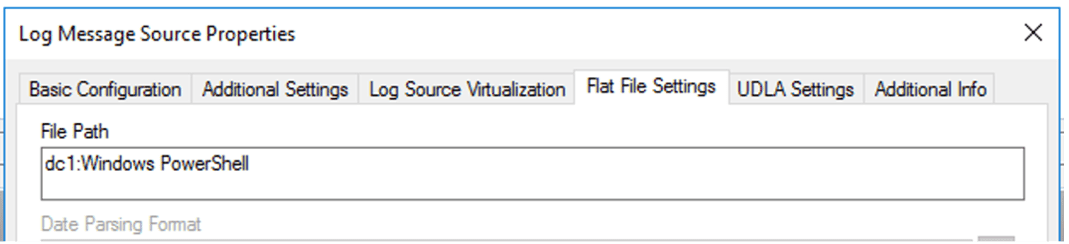
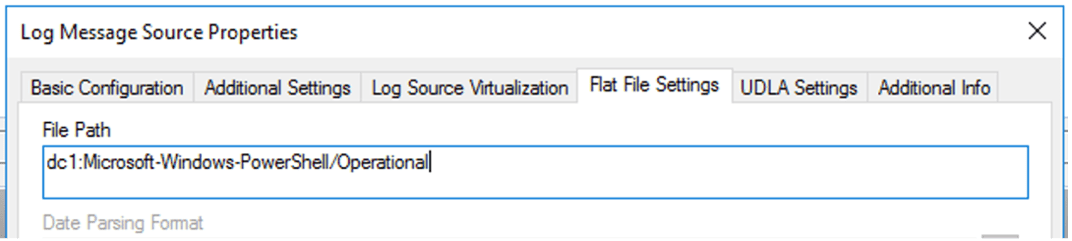
If you are collecting via WEC, then you need to update the collection interface for the Operational log. When discussing the different logs earlier, I mentioned the “Full Name” that the Event Logs use. This is what is configured within LogRhythm for collecting different Windows event logs, where the format is <hostname>:<event log full name>. Therefore, when creating the log source, the Log Source Type can be the same, but the File Path under Flat File settings should be updated to match the right Full Name for the different log sources.
What about Command Line logs?
We’ve looked at PowerShell and how to ensure that anything in PowerShell is collected, but what if they use the Command Line, cmd.exe. You can also enable Logging for the Command Line.
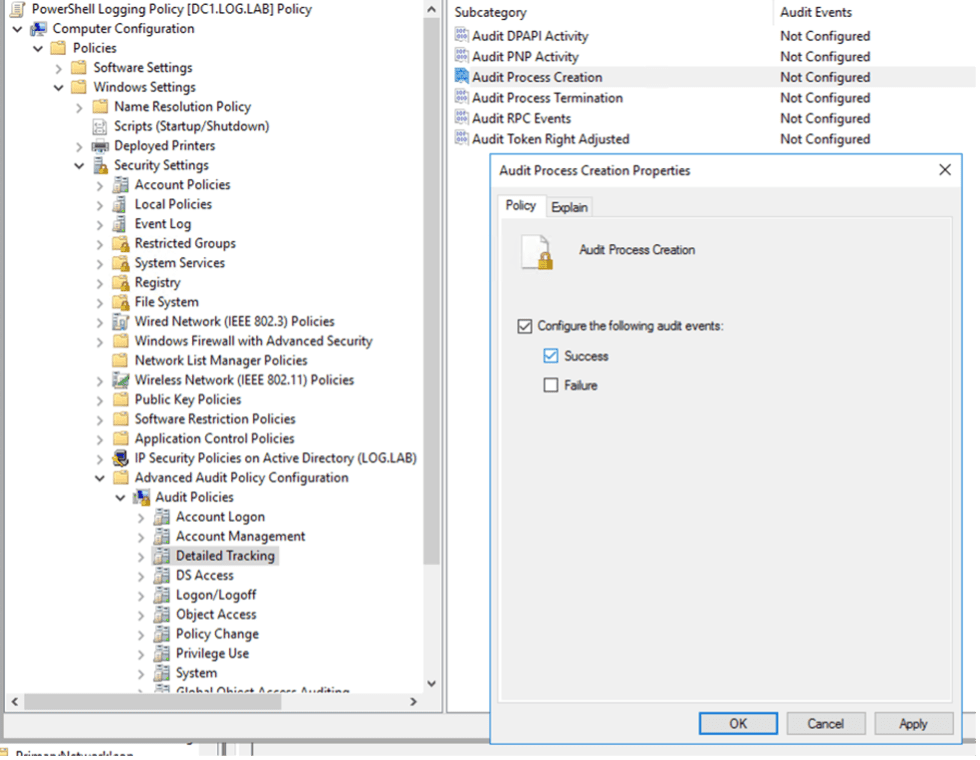
Natively within Windows you can enable the use of Event ID 4688: a new process has been created. This will log whenever any process is launched, which also includes the parent process information. This would show, for example, if there is cmd.exe launching vssadmin, which may be an indication of something suspicious. To enable the logging of Event ID 4688 via Group Policy, change the settings under Computer Configuration > Policies > Windows Settings > Security Settings > Advanced Audit Policy Configuration > Detailed Tracking. Here you will enable the Audit Process Creation to log Success events.
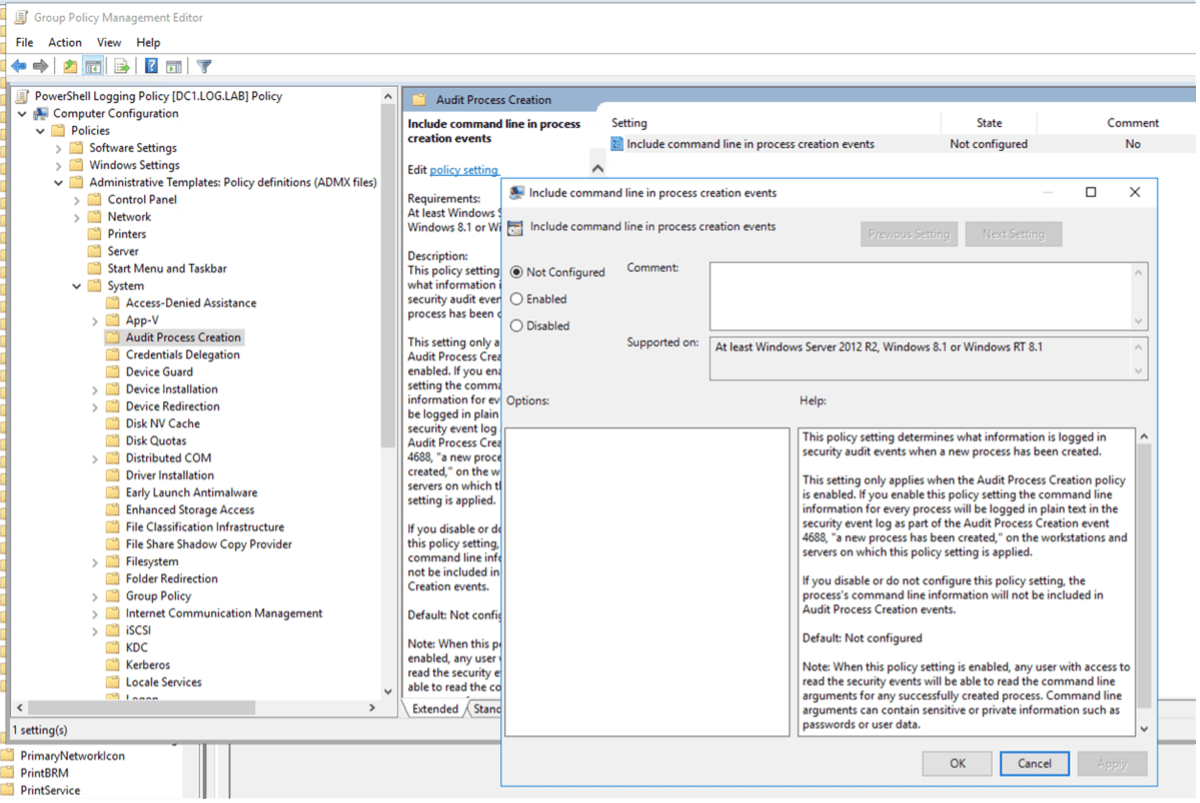
Once enabled, you can see what processes are triggered and who created them. This can provide a lot of information, but there is one final configuration change to enable, where it will provide the command line arguments that were used with the process creation. For example, if an account was using vssadmin, you would see that vssadmin.exe has been created (with a parent process of cmd.exe), however, it would not show if they used “vssadmin list shadows” or “vssadmin delete shadows” which could lead to very different investigations. Having the full command line arguments included in the log will provide the full picture of what is being run in the command line.
From the Group Policy Editor, go to Computer Configuration > Policies > Administrative Templates > System > Audit Process Creation. Here you will find the Include Command Line in Process Creation Events – enabling this will add all the information to the Event ID 4688 and will then be parsed within LogRhythm to monitor with use cases as required.
The alternative option for enabling command line logging is to look at Microsoft SysInternal’s Sysmon tool. This can be configured to monitor for Process Creation events, with Event ID 1 from Sysmon will include the Process creation and full command line for it. With Sysmon you can even add inclusions or exclusions via the XML configuration files, meaning that you can reduce the volume of logs for known executables and applications in your environment. Along with Process Creation, Sysmon can also monitor many other areas of the system, including Network Connections, File Creation/Deletion, Registry Events, WMI Events and even DNS Requests, as well as much more. This all can be tuned with the configuration file options, and there are even baseline configuration files available online, including from SwiftOnSecurity. The downside is that deploying the SysMon agent in your environment will require more effort, however the visibility that it offers is outstanding.
What to do with all these logs?
With PowerShell logs, Command Line logs, and SysMon logs, you may wonder, “what should I do with all this extra visibility I have?” A great place to start is looking at our MITRE ATT&CK module from our Knowledge Base. This has some great use cases utilizing the log sources that we’ve looked at today and will start to show you what is really happening on your endpoints.
The LogRhythm Analytic Co-Pilot team works with customers on a regular basis focussing on Use Cases and having these logs available to build against is beneficial. Whether you are investigating suspicious activities, hunting for PowerShell scripts that shouldn’t be running, and even finding malware that is using PowerShell obfuscation, you use the logs from the configuration we’ve been enabling today. You can even start simpler by looking for commands that you know should never be executed in your production environment; take this list as an example, it can be a great starting point for understanding these logs.


