The Challenge
Generating Actionable Intelligence from Windows Security Event Logs
Microsoft Windows—love it or hate it—is near ubiquitous for desktop, laptop and notebooks, and it still makes an occasional appearance or two across all of the servers running on our pale blue dot.
Therefore, in order to generate actionable intelligence collecting Windows Security Event Logs is up there in the “good idea!” category. Given this, it’s not uncommon for anywhere between 50–90 percent of all collected log and audit data to come from Windows.
That’s a lot of processing and storage to keep all those logs and metadata. So the question becomes: Can we enhance and improve on this?
The Solution
Collecting Windows Security Event Logs at Unsurpassed Processing Speeds with Up to 32% Less Storage
Thanks to the tireless work of the LogRhythm engineering team to update our Agent, as well as the efforts from LogRhythm Labs to develop a new collection interface, you can now collect Windows Security Event Logs at unsurpassed processing speeds with up to 32 percent less storage. Not too shabby!
A little background on the riveting topic that is Windows Security Events Logs: When things happen on Windows, a log message is stored, and it’s called an Event. But to expand on that a tiny bit, Windows Security Event Logs are stored in a language-independent manner.
When collected, the logs are rendered into a language of choice (normally English), and that’s how we traditionally collected Windows Event Logs. However, with enhancements, you can now collect with a newer Windows interface called XML collection, and this results in a smaller, leaner Event log message.
For this experiment, you’ll collect Windows Security Event Log audit data from the same host using the native (Rendered) and new XML collection interface.
Operational Intelligence, one of the features of the LogRhythm WebUI, make the analysis and export simple.
Firstly, you’ll choose a set time range for an apples-to-apples comparison. With the LogRhythm WebUI time selector, you can choose your sample range:
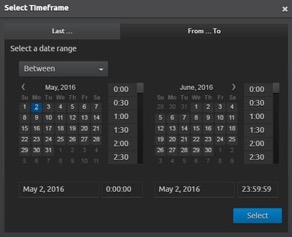
Then, select both of the log source collection interfaces for this host (Rendered and XML). Again, this is an area where the LogRhythm WebUI makes it simple to select and add the log sources you wish to search for using the ever-so-useful type ahead feature that autocompletes what you are typing.

Here are the results. You can validate the sample set of results per log source type to ensure that you have an even sample set. Here you can see that you do, give or take a hundred messages.
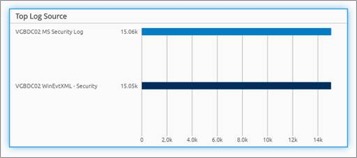
For comparison, here is the full data results set for both Rendered and XML Security Event logs.
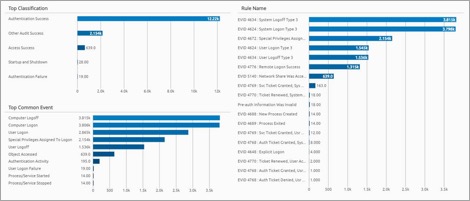
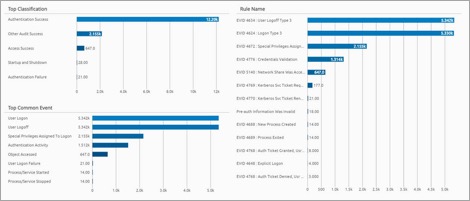
With your result sets above, you can then apply a filter per log source type. Then you can use another powerful feature of the WebUI: export. For your purposes, you’ll export the raw logs and metadata. This feature is immensely useful if you want to perform additional offline analysis, or if needed, to provide a copy of metadata or raw logs to others.

Here’s the downloaded files, including the metadata and logs. Note: Your first clue that you may have a difference in volume is simple: the file size. Note the near 1/3 difference in size. Performing some manual validation of the downloads, both text files include 15,000 results (15,048 each to be precise).

With the logs downloaded and opened up in Excel, you can perform some analytics using pivot tables. (Who doesn’t love a good pivot table!)
Here is the count of Windows Event IDs, along with the average log message size. The red color scale highlights the largest message sizes. The green highlights the smallest.
Some observations:
- The most frequently occurring messages are often the largest. (This makes sense because it’s people logging on and off.)
- The average XML Event Log message was 1086.
- The average Rendered Event Log message was 1596.
- That’s a 32 percent reduction in processing and raw log storage per message. (And we deal with millions to billions of these per day!)
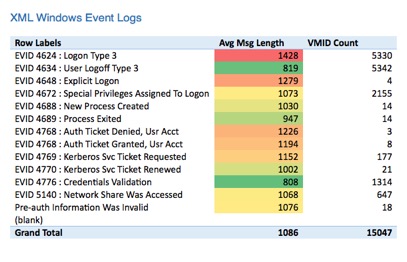
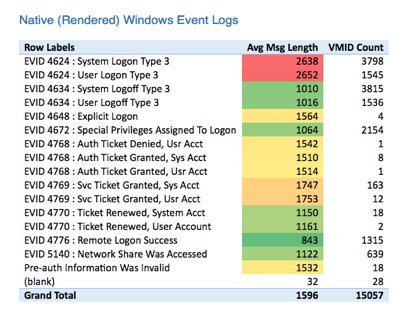
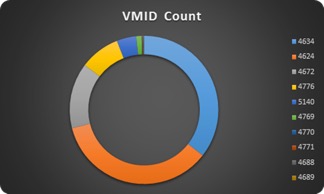
Put another way: You can visually plot the frequency of certain Windows Events (VMID). This confirms what you saw above. The most frequently occurring messages are logon and logoff activities.
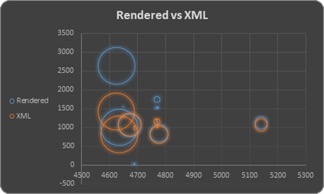
Plotting the data in another manner, you can see that the highest occurring Event Logs are among the largest. Rendered events are in blue, and XML are in orange. You can clearly see the new collection interface is using less space.
Finally, another area for consideration: Not only are you collecting and storing smaller Windows Events with less storage, but now there is also less to process. Here’s a comparison of the processing speed between Rendered and XML Windows Event Logs. Pretty big improvements!
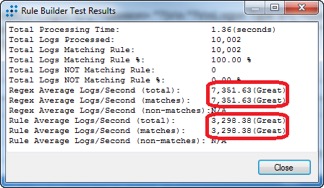
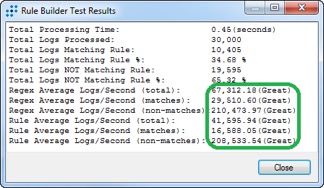
I’d say that’s a great improvement—it’s pretty amazing!
The Value
Enhancements to the LogRhythm Security Intelligence Platform Have a Huge Impact on Performance and Storage
The LogRhythm engineering team and the LogRhythm Labs organization are constantly working to make improvements to the LogRhythm Security Intelligence Platform. The enhancements we reviewed here may not be glamorous, but they make a substantial impact on performance and storage improvements. Now you can collect Windows Event Logs in incredibly compact and efficient mechanisms.