
Jim Lee is an information security analyst and guest blogger from Seismic Software Inc. He is an ambassador of cybersecurity education and empowerment for small businesses. Jim configures easy-to-use tools to develop intuitive solutions for small business cybersecurity programs. His work configuring LogRhythm NetMon Freemium dashboards for a former employer helped the organization win Best Security Hunting Dashboard in the 2017 LogRhythm “Rule Your Network Challenge.”
A Free Network Monitoring Tool for Network Security Analysts
When I worked at Totem, a software-as-a-service (SaaS) solution that offers cybersecurity assessments and compliance monitoring and asset management of building control systems, the company always strived to help businesses find ways to supplement their existing cybersecurity tool suite with low-cost or free network-monitoring solutions. My team and I were excited when we heard that LogRhythm provided a free version of its network security monitoring product, LogRhythm NetMon Freemium.
We wanted to see how NetMon Freemium could help network security analysts — “hunters” as we call them — at small businesses quickly baseline network traffic, identify anomalies, and pursue further investigation. In July 2017, we received permission from a small business client to prototype NetMon Freemium on its internal network and investigate its features.
1. Establish the Target Network
The first step to test how NetMon Freemium could help our client detect threats on its network in real time was to establish the scope of the network. Our client’s target network had less than 20 employees and workstations, and less than 25 Mbps of traffic. Its network hosts typical office devices, including phones, workstations, printers, internal application and database servers, and a local physical security system. We established NetMon Freemium’s scope of visibility as shown below in Figure 1.
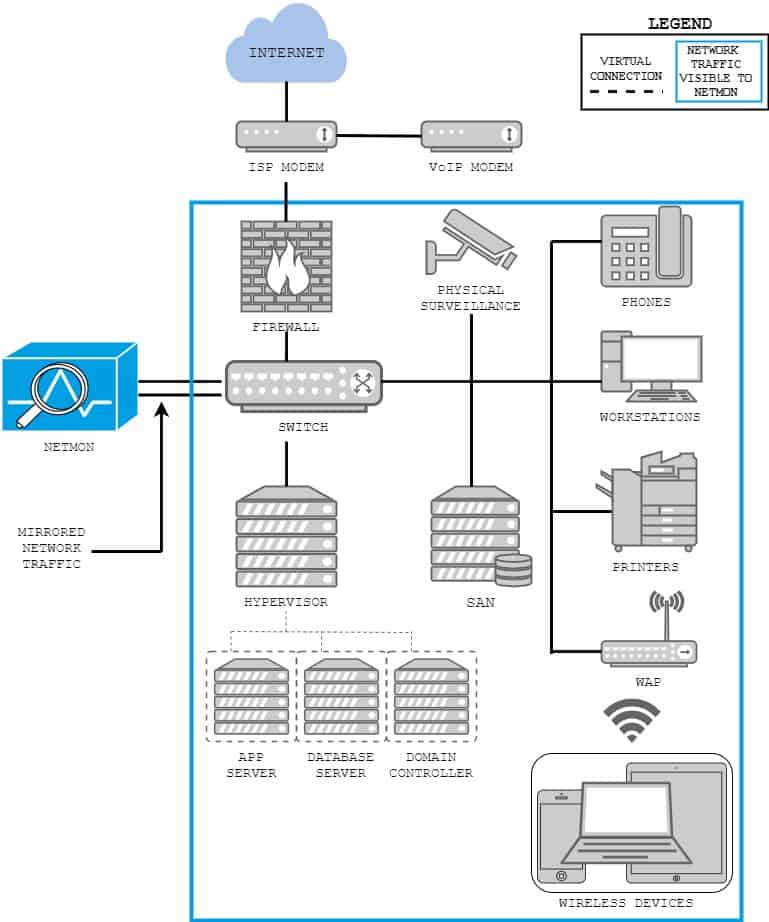
Figure 1: Network traffic visible to LogRhythm NetMon Freemium
2. Integration and Testing
NetMon Freemium provides out-of-the-box, browser-based interfaces that contain an immense amount of network traffic data for a hunter. It also allows the hunter to adjust the front-end interface to suit his or her needs. For example, the “Analyze” user interface allows the following configurations:
- Ability to configure displayed data period over minutes, hours, days, weeks, and months
- Lucene queries on available detected Elasticsearch fields to filter captured traffic
- Metadata summaries of network flow sessions which include application path, IP addresses, and MAC addresses
- Option to turn on packet capture for analyzed traffic flows
- Ability to download captured file and packet streams in PCAP format
- Replay functionality with PCAP formatted network
Alone, the ability to automatically format and download PCAPs makes NetMon Freemium a valuable tool for the hunter; other free (and not-so-free) tools lack this ability out of the box.
Reducing a hunter’s analysis time on forensic tasks, such as file carving from a TCP stream, is imperative for a business with limited time resources.
3. Baseline Network Traffic with Visualizations and Dashboards
Next, we investigated the effectiveness of the integrated visualizations and dashboards within NetMon Freemium for baselining network traffic to facilitate identification of anomalies.
We used the SANS Institute’s SANS DFIR Network Forensics and Analysis Poster as a practical guide and ad hoc checklist for baselining network traffic. The poster, DFIR-Network_v1_4-17, is available here for download with SANS account. The explanations of analytical methods outlined in the “Network Traffic Anomalies” (NTA) section of the poster clarified what data and information we needed to display in the Kibana visualizations.
Below, Figure 2 shows an example of a Kibana dashboard based on an NTA. This dashboard contains visualizations to meet the “HTTP GET vs POST Ratio” and “HTTP Return Code Ratio” anomalies shown in the NTA poster.
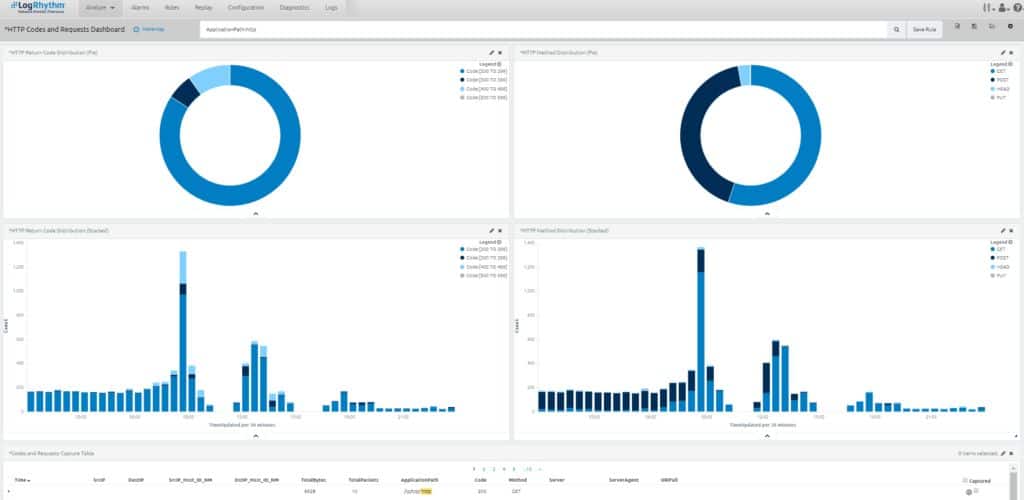
Figure 2: Kibana dashboard visualizing anomalies in network traffic
4. Use the Kibana NTA Dashboard for Investigation
The following table outlines how a hunter would use the Kibana NTA dashboard. The left-hand column describes baselining activities, and the right-hand column describes anomalies that would trigger a hunter to investigate suspicious network activities.
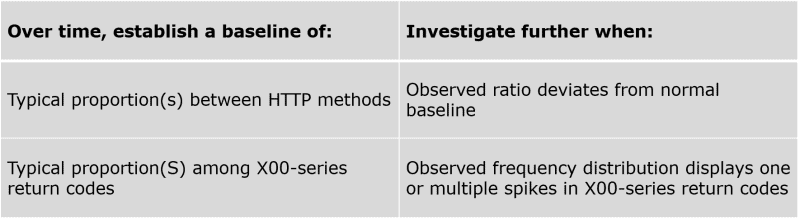
Figure 3: Instructions for using the Kibana NTA dashboard to investiagte network activities
5. Analyze the Results of the Evaluation
Our team used the matrix shown in Figure 4 to evaluate how LogRhythm’s NetMon Freemium could help the hunter analyze network traffic against each NTA for a small business.
We used three criteria for the evaluation:
1. Ease of Implementation: How difficult was it to implement visualizations?
- Easy: Visualizations exists out-of-the-box, only requires simple reconfiguration
- Moderate: Requires some development and re-configuration
- Challenging: Cannot create from the “Visualize” environment, or requires significant development (e.g., Lua scripting within the tool)
2. Ease of Anomaly Detection: How quickly can the hunter discover anomalies after establishing a baseline?
- At-a-glance: Deviations are immediately apparent within the visualizations
- Deeper look: Deviations require cross-referencing with other organized information or more in-depth examination of visualizations and associated capture table to recognize oddities; for instance, a scroll through the chart legend may be required to spot deviations
3. Additional Tools Required?: Are additional software or network tools required to complete analysis?
- Yes: Analysis requires at least one other tool (Nmap, Wireshark, SIEM, firewall logs, etc.)
No: Out-of-the-box interfaces and drill down tools are sufficient to complete analysis
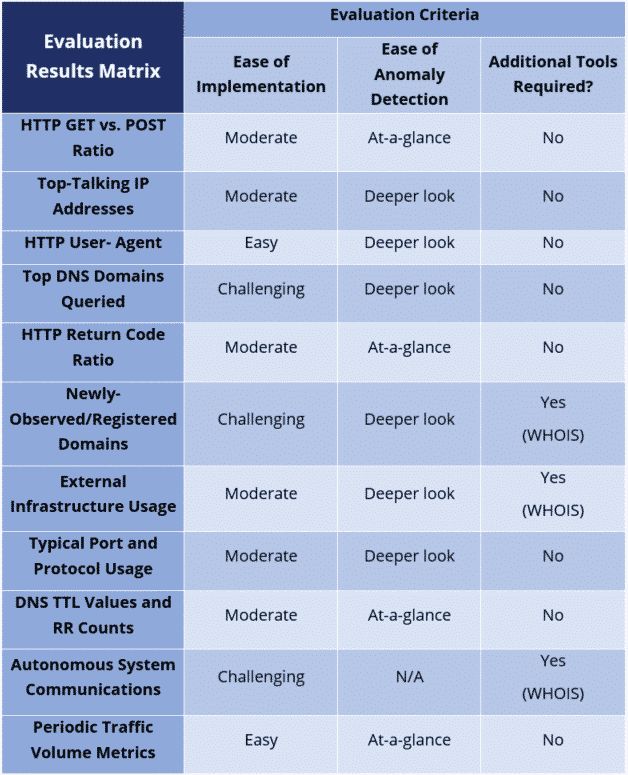
Figure 4: Matrix used to evaluate LogRhythm’s NetMon Freemium for a small business
As you can see in the matrix, we were satisfied with NetMon Freemium as an effective addition to the cybersecurity toolkit for a small business hunter. The cost of the necessary hardware was also reasonable for a typical small business. The process to install and integrate the product into an enterprise’s network environment was painless. LogRhythm even has a helpful FAQ sheet that provides information on the hardware required to have the best results with NetMon Freemium.
Benefits of NetMon Freemium
The user interface and experience in NetMon Freemium are intuitive and easy to configure for most of the NTAs we judged the tool against. We successfully created dashboards for 10 of the 11 NTAs presented in the SANS poster. NetMon Freemium met a few of the NTAs right out-of-the-box, and in short-order, we were able to create novel dashboards that could help the threat hunter identify other anomalies.
The ability to drill down into a packet, flow, or PCAP within seconds of identifying an anomaly helps a hunter investigate quickly and efficiently and automatic packet capture of (all, if desired) traffic flows distinguishes NetMon Freemium from other tools. NetMon Freemium could be the only tool a hunter would need to identify an anomaly and determine the root cause for several NTAs.
Once the tool has been installed and configured for the given business environment, we predicted that a threat hunter would spend half an hour to an hour a day using the dashboards to establish baselines of normal network traffic. Once the hunter is comfortable with the baselines, he or she should be able to quickly spot anomalies during that same half-hour period, and then use the tool to plan and execute further investigations.
Get Started with LogRhythm NetMon Freemium
LogRhythm NetMon Freemium is a valuable tool for someone hunting network traffic anomalies in an enterprise’s network — especially because the software is free. Although it has some front/backend limitations, it meets many industry best practices for network traffic analysis. It can certainly help the hunter baseline network traffic, identify anomalies, and pursue further investigation.
You can find more information on NetMon Freemium and download it here. For additional support, we found the LogRhythm Community was extremely helpful with deployment and configuration.
Good hunting!