These days, it seems that just about everyone is talking about the Internet of Things (IoT). According to recent forecasts from Gartner, 6.4 billion connected things were in use worldwide in 2016—up 30 percent from 2015. As digitally connected devices continue to work their way into every aspect of our lives, gleaning operational and security insights from IoT data should be a top priority.
The good news is that it’s easy to make sense of this data. To show you the power of IoT data, I have assembled some data samples and generated a couple common IoT use cases in our LogRhythm Demo Lab. Let’s take a look at a list of use cases below.
IoT Use Cases
Utility Usage Monitoring
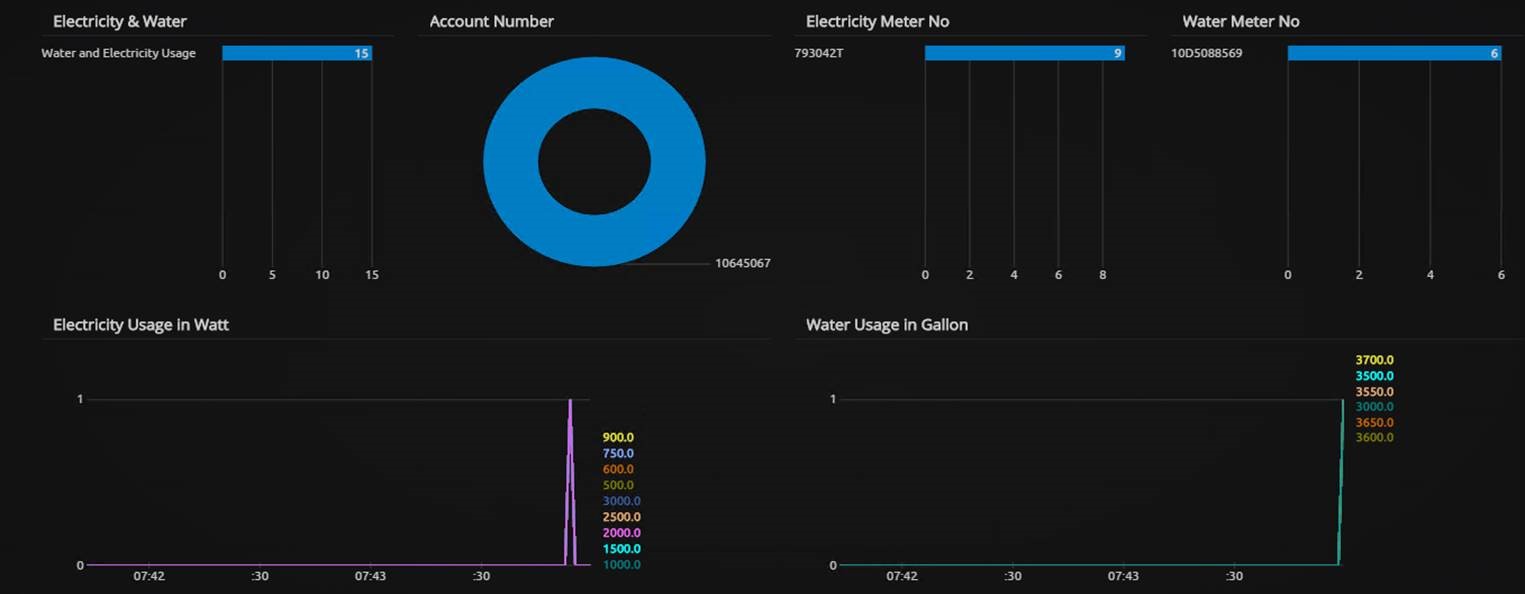
This use case enables me to monitor water and electricity usage. Here, by tapping into practically any smart meter that can share logs, I can even see usage by account number or by meter number.
Click on images to view larger
Figure 1: Dashboard Showing Water and Electricity Usage
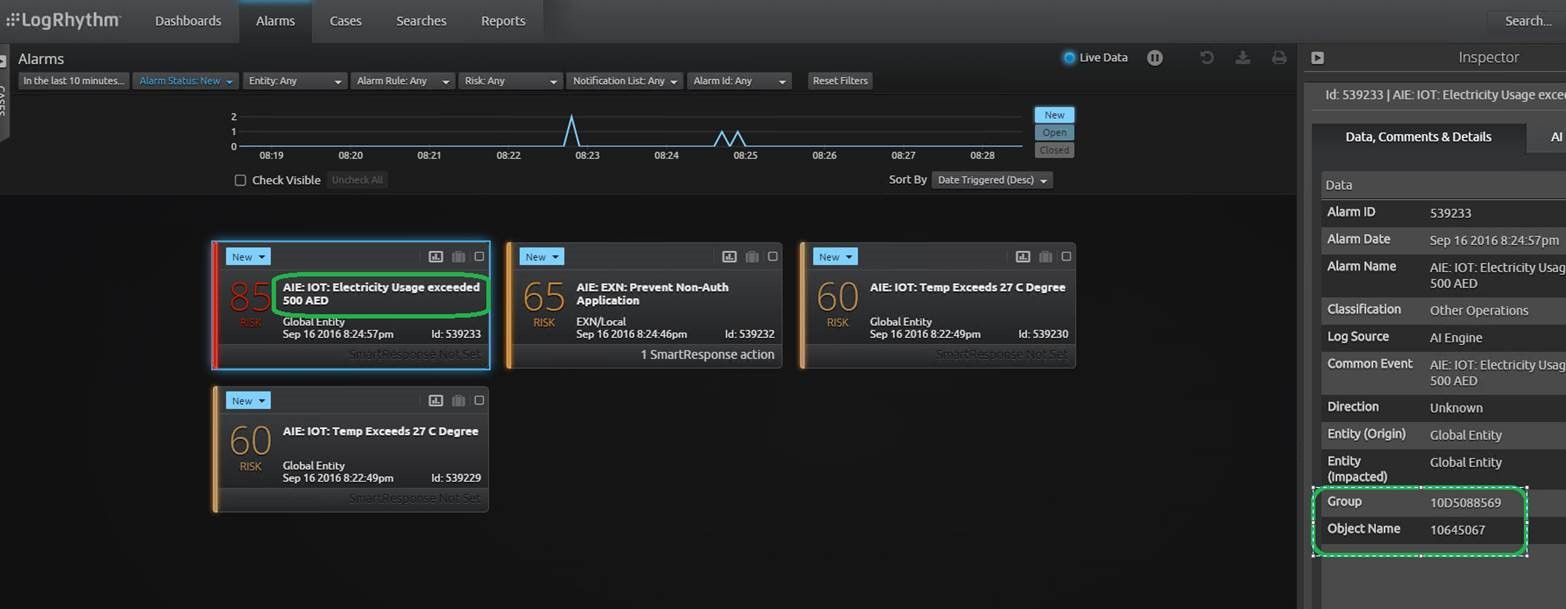
I can even take monitoring a step further by setting up an AI Engine rule to trigger an alarm if electricity usage exceeds a certain level. In this example, I set the rule to alert if usage surpasses 500 AED. A quick drill down revealed which specific meter is being affected so I can investigate the root cause of the excessive use.
Figure 2: AI Engine Alarm Triggered by Excessive Use
Figure 3: Alarm Drill Down to Reveal Meter in Question
Managing Facilities
In this industry, many times cyber interacts with the physical world. Here I’ve set up a use case that can monitor physical exit points. With this dashboard, I can see the status, open or closed, by location. An open exit point can increase organizational risk or just waste precious energy.
Figure 4: Dashboard Showing Physical Exit Point Status
Ambient Temperature Monitoring
Air conditioning is a major cost for any organization and maintaining proper temperatures can be a challenge. In the next set of use cases, I tackled monitoring ambient temperatures and subsequent alerting.
Below you can see that I can track air condition by temperature and location. I can do this by ingesting data from internet connected thermometers and control systems.
Figure 5: Dashboard Monitoring Temperature by Location
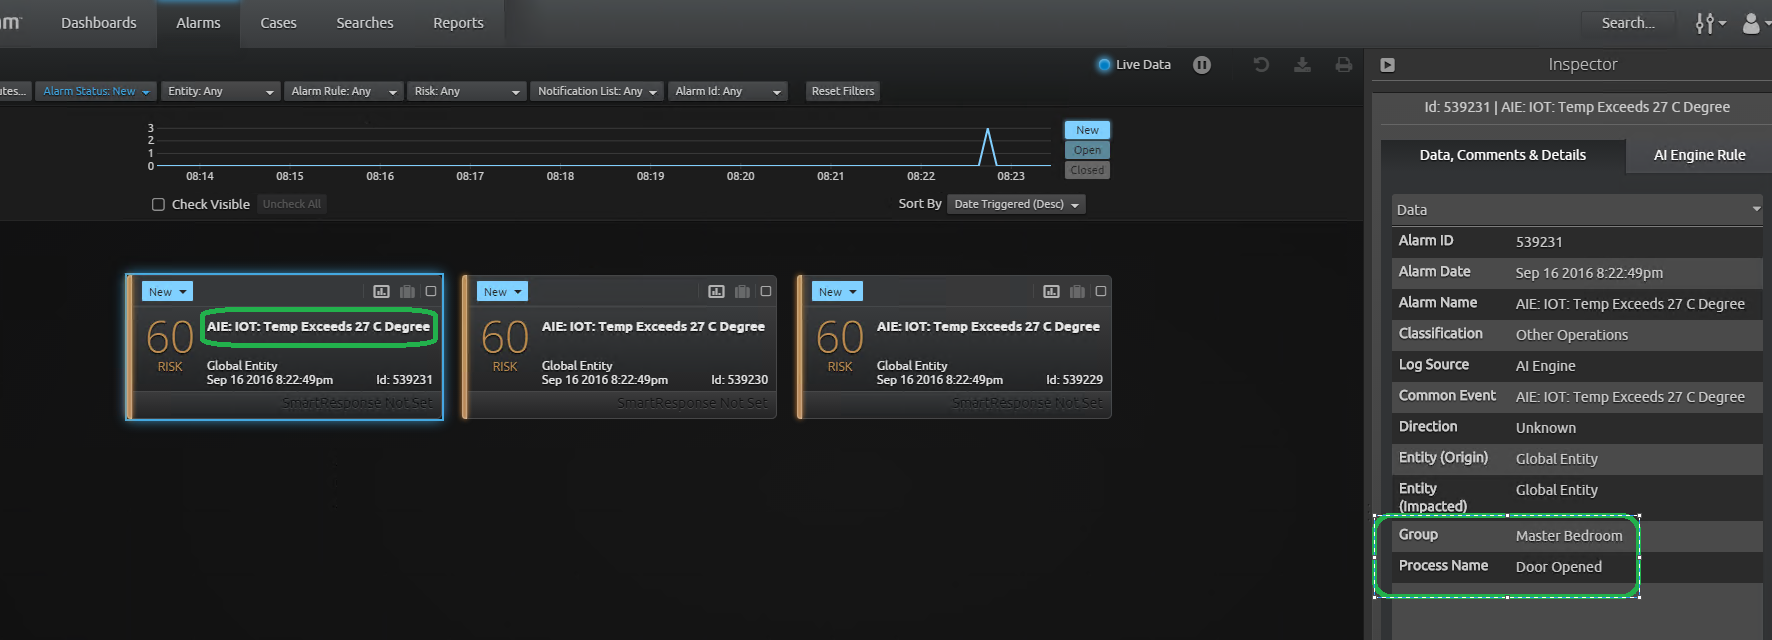
Once I was properly monitoring temperatures, the next logical set was to set up a rule to raise an alarm if the temperature exceeded a certain amount. In this case, I set the alarm to trigger if temperature surpassed 27 degrees Celsius. A quick drill down can reveal the location. By tying in the data from the physical exit points, I can easily find out the reason for the temperature change. In this case, the cause is an open door.
Figure 6: Alarm Indicating Excessive Temperatures
IoT data can be very helpful when utilized by organizations. The key is being able to effectively manage this data and turn it into actionable insight.
With LogRhythm, log management is a breeze as data can easily be ingested, organized and processed. The highest value comes from the operational and security intelligence generated by our AI Engine technology. This allows me to turn the raw data into real results. Think about how to expand these use cases and work to apply them in your environment.


