
In the past few years, we’ve seen a massive uptick of interest in leveraging cloud infrastructure from Logrhythm customers. Just a few years ago, organizations viewed cloud as an interesting proposition for a few use cases. Today, we see many critical business functions either being migrated to cloud platforms, or new cloud solutions completely replacing their on-premise counterparts.
With the proliferation of “cloud-first” initiatives, partially fueled by the rise of DevOps practices, cloud is becoming a first-class citizen of many businesses. In response to this, the need for IT to effectively monitor these cloud environments is rapidly becoming an integral and critical part of both IT security and IT operational monitoring.
Transforming the Cloud Definition
Organizations face a conundrum when it comes to monitoring cloud environments. One complication is the fact that each cloud provider is offering more and more services and options for customers to use in the cloud. A few years ago, to most people “cloud” meant “just someone else’s virtual machine.” Today, cloud can mean anything from running a dedicated Linux VM in Azure or running PostgreSQL as a service in GCP, to running serverless functions in AWS Lambda and about a million other things.
The very definition of what cloud is, and what cloud is capable of is changing week to week — it’s a fascinating transformation in IT. That’s the good news. The bad news is that for IT security and IT Ops teams, keeping up with the latest and greatest can feel like a full-time job. Keeping up with all the changes across all cloud solutions can often feel like an impossible task.
Fortunately, cloud providers like Amazon, Azure, and GCP are recognizing the need for organizations to quickly and easily consume and analyze the log data that their various services generate. Over the last few years, cloud providers have responded to this need in many ways — some since (frustratingly) abandoned. But over time, we’re starting to see more mature and polished capabilities. With the addition of inbuilt cloud tools, cloud providers can satisfy security and ops monitoring. For example, in the security space, we have Azure Security Center/Sentinel or GCPs Cloud Security Command Center (Alpha) or Backstory.
While these types of solutions can address individual use cases, the need for comprehensive monitoring and collection across the entire breadth of a company’s IT infrastructure remains. This can be driven by audit or compliance requirements, security directives, IT operational monitoring standards, or GRC initiatives.
This is where the LogRhythm NextGen SIEM Platform can really help customers. LogRhythm centralizes log data from various environments, including multiple vendors providing cloud software as a service (SaaS) and infrastructure as a service (IaaS) solutions. Customers can ensure that their entire IT platform is monitored holistically, regardless of the underlying complexities of cloud.
The Cloud Monitoring Use Case in Action
We’re a big proponent of the “crawl/walk/run” approach — start with a business need, ensure the blocking and tackling is complete, and then iterate the solution until ultimately the entire use case is complete. In that spirit, we’re providing a quick overview of how to use the LogRhythm NextGen SIEM Platform for cloud monitoring. In this initial scenario, we’ll be utilizing AWS as our example. But as with most things cloud, this same concept could be similarly applied to Azure, GCP, or other cloud platforms.
The business need behind this driver is to monitor the activities of the DevOps team and the automations that it uses to look for potentially suspicious behavior. This behavior could be an individual DevOps account that has been compromised, an automation task has been running wild, or a potential insider threat.
With cloud, the distinction between what appears to be a security use case and an operational use case is fuzzy — this use case addresses both types.
Step one in this use case (as with all use cases) is to collect data in order to gain visibility. LogRhythm has inbuilt support for various AWS log types that benefit this use case, including AWS CloudTrail, CloudWatch Alarms, CloudWatch Logs, Configuration Events, and Server Access Events. We use AWS APIs to pull this data into the LogRhythm NextGen SIEM Platform, and parse and normalize this data with our Machine Data Intelligence (MDI) fabric. For full documentation on how to collect these log types in LogRhythm, see our online help documentation here.
Once we acquire that log data, we can quickly review the overall activity in the environment, including the relevant portions of metadata that can then be leveraged for our use case. Below is an example of an AWS Activity Monitoring dashboard:
 Figure 1: An AWS Activity Monitoring dashboard
On this dashboard, we can see the various common events and executed commands, the users that are executing them, the individual accounts that are being impacted, the role types they represent, the hosts these are executing from, the AWS regions they are impacting, and the results of those actions. This is just a small subset of the types of data that we collect from AWS, but for the purposes of our use case they represent the metadata fields in which we are interested.
Being able to monitor this data in real time, visualize it through a dashboard, and hunt among this data for suspicious behavior is just the beginning of this use case. Most importantly, the out-of-the-box parsing of the data into easy-to-understand activities — and visualization and hunting among that parsed data — allows a LogRhythm user to quickly start understanding the types of activities that are occurring in the AWS environment.
As is often the case, what is “unusual” or “suspicious” for one customer may be completely benign for another customer. Having quick access to the data, and making that data easy to understand and work with, lowers the barrier for IT teams to start crafting use cases custom tailored to their needs.
Next up, it’s time to put intelligence behind these findings. In our case, we used the data above to identify potentially suspicious activities that we would like to monitor. Specifically, this includes AWS role deletions, password changes, security group creations, login profile deletions, account limit additions, general user updates, security group deletions or changes, and network interface attribute changes. While other activities (VM creations and teardowns, storage provisioning and mapping, etc.) are expected during the day-to-day utilization of the AWS platform, these represent what most businesses have determined are uniquely suspicious behaviors in their environment.
To automate this intelligent detection, we will use the functionality of LogRhythm’s AI Engine to correlate and identify individual suspicious behaviors, and then look for the same user account experiencing a higher than expected volume of these behaviors. Following is a general overview of the analytics rule:
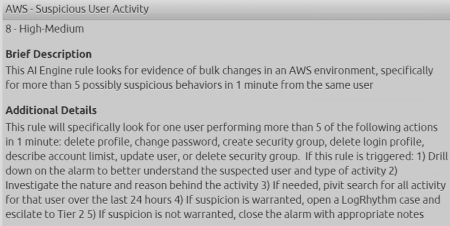 Figure 2: AWS Suspicious User Activity AI Engine rule
In the logic of the AI Engine rule, we can specify from what types of log sources and what types of behavior this rule will evaluate against:
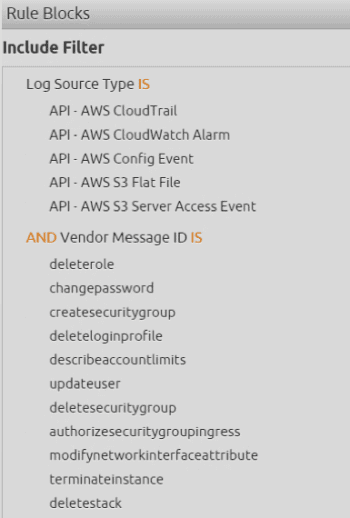 Figure 3: Specify log sources and sought out behaviors in the AI Engine rule
And finally, we can determine either statically or dynamically the threshold of these activities that represents true risk (versus simply being pummeled by noisy alarms for benign behavior). Here we can see that this rule is looking for the same user as Figure 4 or more of the behaviors in a one-minute time period.
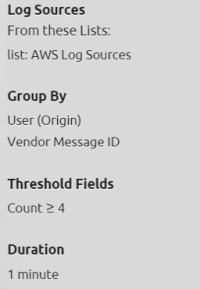 Figure 4: Determine the threshold of activity that represent a risk
Once detected, we will raise an alarm for this behavior to an analyst, including an overall risk rating derived by our Risk-Based Priority algorithm. This allows the analyst to quickly understand the type of behavior detected, as well as prioritize that alarm based on the risk:
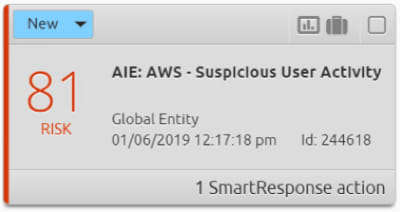 Figure 5: Notify an analyst of suspicious activity with an alarm
In a simple drilldown on this alarm, an analyst can quickly understand the nature and scope of the particular behaviors detected. In this case, it appears that some automation has gone wrong and deleted five separate AWS roles instead of the one it was intended to:
 Figure 6: Analysts can dig deep to identify the detected activity
In this example, we used the LogRhythm NextGen SIEM Platform to detect an operational issue — a bit of automation gone awry. This allows the IT team to quickly fix this issue — restore the roles, patch the damage, and fix the automation.
However, this could have just as easily captured a malicious or compromised user account. If that were the case, an analyst could use the LogRhythm NextGen SIEM Platform to work this as a security incident as follows:
- Create a case based on this alarm in the LogRhythm NextGen SIEM Platform with our built-in Case Management functionality:
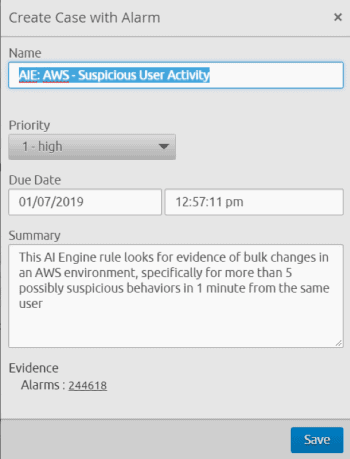 Figure 7: Create a Case in the LogRhythm NextGen SIEM Platform
2. Attach a playbook to the case to better track the individual steps necessary for resolution and to ensure that processes are described and repeatable:
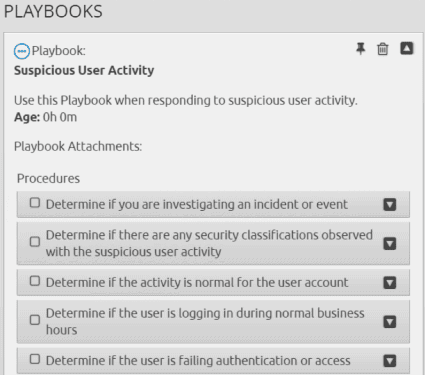 Figure 8: Playbooks provide steps for a resolution
3. Use remediation automation; in this case, the customer’s AWS logins are gated through Okta, so we can suspend access into AWS quickly and easily:
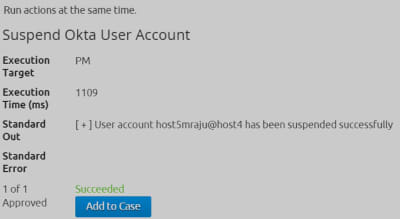 Figure 9: Use remediation automation to resolve the issue quickly and easily
The First of Many Cloud-Monitoring Scenarios
As mentioned, this only scratches the surface of what is possible in the realm of cloud monitoring — thus, this is the first scenario. There are many other great use cases to dig in to, and some really powerful extensions on this use case that could be beneficial.
Let us know what you come up with in this space. We encourage anyone reading this post to become active in our community and share your ideas!