The need for water critical infrastructure (CI) cybersecurity has become a growing concern as a recent cyberattack has made national headlines. On February 8, 2021, a hacker modified chemicals in a water treatment plant in Oldsmar, Florida.
During a press conference covering the incident, Pinellas County Sheriff, Bob Gualtieri, explained the cyberattack in more detail:
“The hacker changed the sodium hydroxide from about 100 parts per million to 11,100 parts per million. This is obviously a significant and potentially dangerous increase. Sodium hydroxide, also known as lye, is the main ingredient in liquid drain cleaners. It’s also used to control water acidity and remove metals from drinking water in the water treatment plants.”
After the hacker increased the chemical levels, a plant operator noticed immediately and mitigated the risk before serious damage could occur to the public’s health and safety.
We have witnessed similar cyberattacks on water systems for decades now.
In 2001, a cyberattack on a waste-management system in Australia caused untreated sewage to leak into rivers, parks, and surrounding neighborhoods. As a result, rivers were contaminated, marine life died, and residents had to deal with unsanitary living conditions.
The incident in Florida and Australia are just two examples of how cybersecurity attacks on public water systems have been used in warfare and cyberterrorism throughout history.
Water Treatment Plant and Critical Infrastructure Cybersecurity
Security risks with water utilities are a growing concern. Our dependency on safe water makes water a critical infrastructure — an asset that is essential to the nation’s livelihood and crucial to protect. Our health, energy, agriculture, and emergency services are just some examples of infrastructures that rely on safe water.
In this blog, we will show you how an operational technology (OT) security operations center (SOC) team uses real-time monitoring to quickly detect, locate, and shut down contaminated water pipes during a security or operational incident at a water treatment plant.
Potential Threats to Water Critical Infrastructure
Threat actors can attack water at its source, treatment plant, storage facility, or distribution center. In this example, the potential target is a treatment plant that administers chemicals like chlorine into the water to kill bacteria to make the water safe to drink.
The treatment plant uses supervisory control and data acquisition (SCADA) systems to monitor and control all of its processes from a central location. If an attacker gained access to the plant’s SCADA network, they could shut down its systems or degrade the quality of the water running through the pipes.
How to Detect SCADA Network Security Threats
Analyzers are placed in the treatment plant’s water distribution pipes to measure the quality of its water and chlorine levels. This data is delivered back to the security team and recorded in a software program called Data Historian.
Data Historian records the treatment plant’s production and process data over time and stores analog and digital readings on water flow rate, valve position, temperature, pressure, etc. for analog and digital readings.
To effectively observe, collect, and analyze the data from Data Historian in one interface, the team uses the LogRhythm NextGen SIEM Platform. By using SIEM software, the team can monitor its entire SCADA network in real time to quickly detect and respond to any changes in the quality of water running in the pipes — signs of a potential attack.
Real-Time Monitoring of SCADA Network
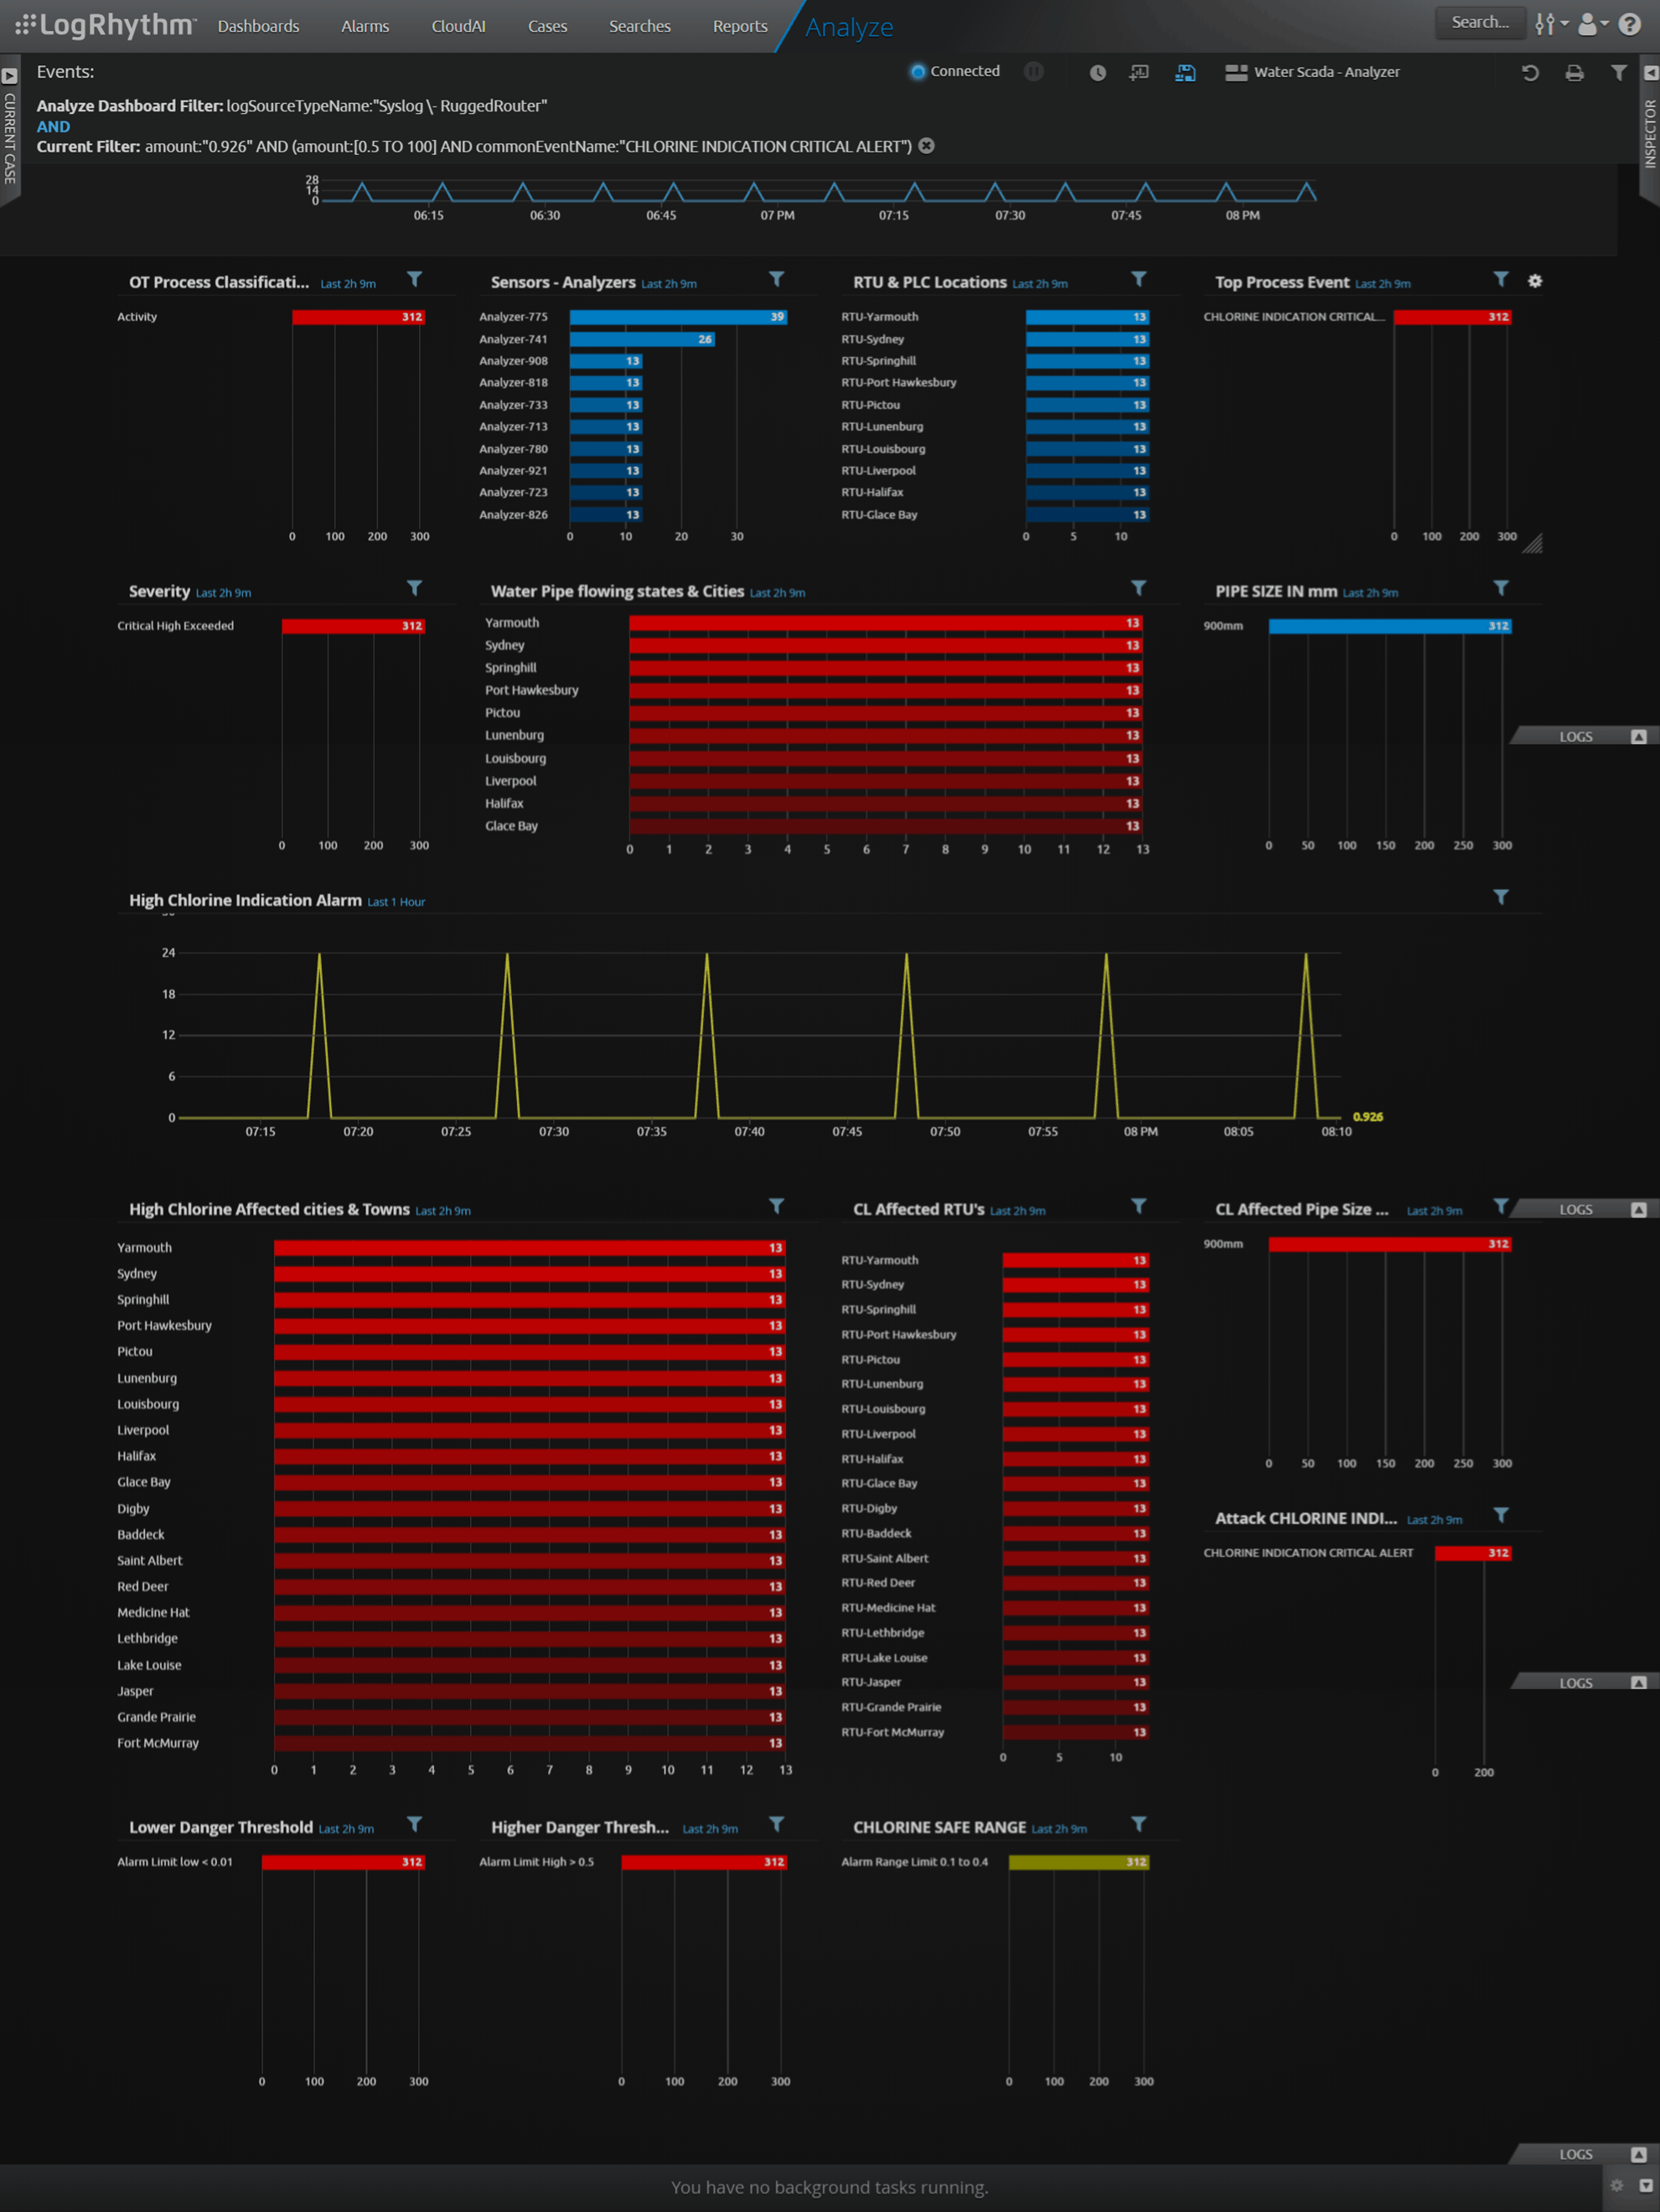
The LogRhythm dashboard gives operators visibility to the entire water treatment plant’s SCADA network. Several dashboard widgets help the team quickly detect any changes in the system’s normal traffic and allow for immediate drill-down.

Trend Range Widgets
Trend range widgets identify any deviations from the acceptable ranges for drinking water during a specific period. The normal range for chlorine administered in drinking water should be between 0.1 to 0.4 parts per million (PPM), and the pH levels should be between seven to nine. Anything outside the normal ranges could be a sign of an operational problem or security attack.

The below visualization of a chlorine indication trend range widget shows a significant drop in traffic between 7:25 to 7:30. During this time, controllers didn’t receive any traffic data from analyzers. An intrusion and obstruction of the analyzers could have caused the dip; therefore, this indication warrants further investigation.

Below a chlorine indication level trend range widget shows a spike in chlorine levels outside the acceptable drinking range of 0.01–0.4ppm. This requires immediate attention. The pipes with the affected water should be located and shut down.

Range Drill-Down
A range drill-down provides a more in-depth look into the abnormalities found in the normal trend range. The below drill-down identifies the affected pipes and their exact location so the team can shut them down.

In this case, the security team used real-time monitoring to quickly detect and locate pipes carrying unsafe drinking water.
Protecting the Nation’s Critical Infrastructure
Cyberattacks on water systems are terrifying scenarios that can have significant impacts on public and economic health.
With LogRhythm’s SIEM solution, the treatment plant’s security team has the visibility and security analytics it needs to monitor the entire network and detect dangerous drinking water before it reaches the public.
Get more tips on water critical infrastructure cybersecurity! This article is part one of a two-part series. To learn how the treatment plant’s security team can create rules that trigger an alarm at the sign of an attack and drill-down into the alarm to find the root cause, visit part two of this blog series.
This blog was originally published in 2019 and updated in February 2021.


