Microsoft Azure is one of the fastest growing cloud platforms on the market. Often, when an emerging technology grows so fast, organizations end up with knowledge silos. In the case of Azure, your DevOps team may be up and running in production. As an afterthought, it might toss accountability for cloud security of the environment over the fence to you.
If you’re new to Azure cloud security, you need to know the top six tips to monitor and secure your Azure Environment.
Over the last year, Microsoft consolidated its event logging approach for most of its cloud services into EventHub. At LogRhythm, we have been hard at work building broad and flexible support for both current and future services that deliver or will deliver logs through this route.
If you’re a LogRhythm customer and are ready to start your Azure journey, you’ll need to install and configure the LogRhythm Open Collector and EventHub integration. More details, including documentation of both configuring Azure Monitor and the Open Collector, can be found in the Documentation & Downloads section of the LogRhythm Community here.
The Azure Activity Log is a core part of Azure Monitor. This makes up the “Control Plane” logs. If you think of any resource in Azure as a black box, the Activity Log will capture anything outside of that box. It’s similar in concept to AWS CloudTrail.
Common examples include:
The Activity Log is easy to monitor. You (or your Azure Team) can perform a one-time (per subscription) export to an Event Hub, then use LogRhythm’s Open Collector to bring the logs into your deployment.
As with all logs, the format doesn’t lend itself to easy consumption and reading by humans. It’s a json formatted log, but at a glance, it doesn’t immediately hit you with the key information. This is where LogRhythm’s normalization and enrichment of log data comes in. LogRhythm processes the data into individual metadata fields and enriches with context such as geolocation, user identity, and risk.
Figure 1: Snippet of json log from Azure
Figure 2: Snippet of LogRhythm enriched metadata view of log
Any time you see an Activity Log, you should be able to determine the who, what, when, and where. LogRhythm normalization helps you determine this much more quickly and easily.
Here’s a basic example:
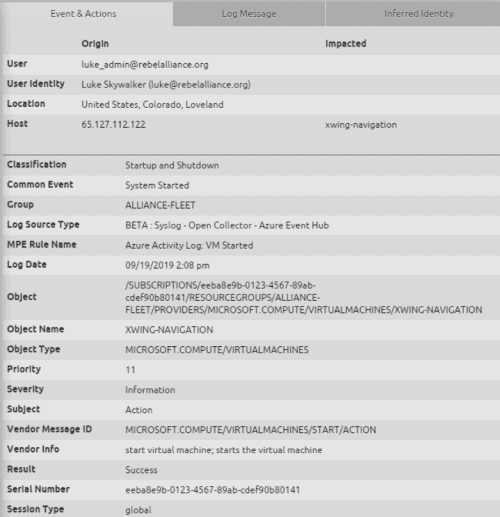
Figure 3: An Azure Monitor Log shows the user name, system name, and action and other metadata for other use cases
From this, we can see that Luke successfully started the Virtual Machine named XWing-Navigation.
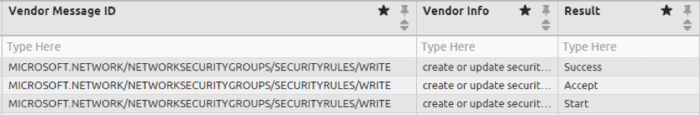
In contrast to traditional on-prem technologies, you’ll find most Activity Log actions have multiple logs associated with them, typically with different values in the Result field (Start à Accept à Success/Failure). This is because the Azure API is asynchronous, and gives you a new log at every step in the process.
Figure 4: Three Azure Monitor Activity Logs from the same action, each at a different state
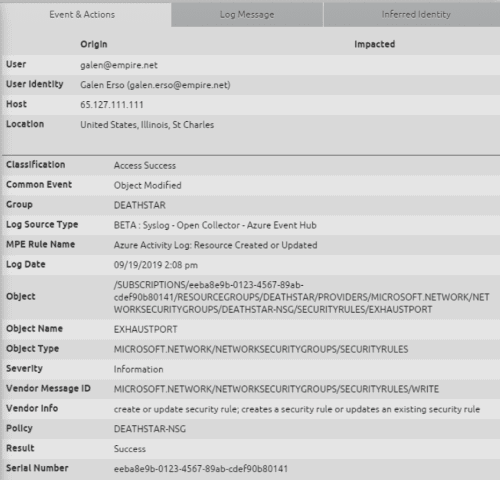
Unfortunately, the activity logs don’t provide the same context at every stage. A good example is creating Network Security Group Rules, which is analogous to an AWS VPC ACL or standard firewall rule. The log shown in the top row of the table above, where the Result is “Success” looks like the following:
Figure 5: An Azure Monitor Activity Log shows a user creating a Network Security Group Rule
You can see here that the NSG Rule (named “EXHAUSTPORT”) was successfully created; however, the underlying Azure log doesn’t provide the content of the rule. Is it an allow or deny? What ports and IPs opened?
To answer those questions, there are a few options:
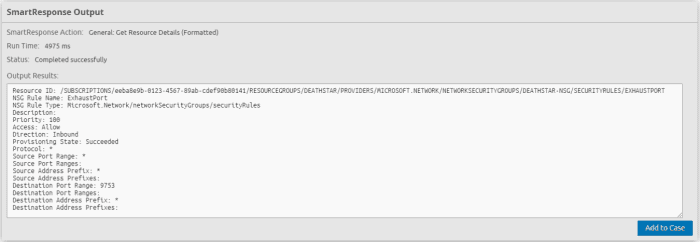
Our preference is LogRhythm SmartResponse. In a perfect world, you’d be investigating within minutes. In reality, we know you may be investigating hours or days later. By using a SOAR security solution such as the SmartResponse automation plugin, you get real-time context and information about the rule.
Figure 6: Real-time context about the Network Security Group Rule, which allows unrestricted inbound traffic into port 9753
One final note: Microsoft doesn’t differentiate between a create or update. If you want to determine if this resource existed before, perform a pivot search on the Object field.
Once you understand what content and fields are available in an Azure Monitor log, you can begin to catalog your Azure implementation. This will empower you to determine what’s normal and what’s not, threat hunt, and build AI Engine analytics to assist your Azure cloud security efforts.
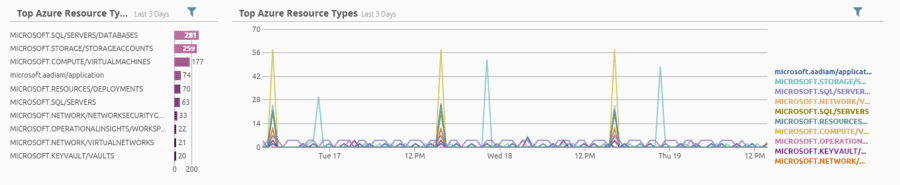
The Object Type field contains the Azure Resource Type. This is an interesting field to build a Top X or Trend widget.
Figure 7: You build a Top X or trend widget in the object type field
Many customers only have resources in specific Azure Regions. By understanding in which regions you have resources, you can determine if there is unexpected activity down the road. A region can be found in the Session Type field in Azure Resource logs; it is not applicable in Azure Active Directory diagnostic logs.
Note that the Azure Activity Log sometimes lists the region as “global.”
You probably have multiple Azure subscriptions, each used for different purposes like staging versus production.
You can run a report or build a Top X widget on the Serial Number field, which contains Azure subscription IDs from your logs. Your Azure team can help you identify which subscriptions those map to. From there, you can build LogRhythm lists and filter dashboards, searches, and AI Engine rules based on the type of environment. For example, you may create an AI Engine threshold rule to alert when multiple errors occur, but only for your production Azure subscriptions.
Hunting for anomalies in your Azure environment gets significantly easier once you know what “normal” looks like. Until then, there are some events and behaviors you can monitor to improve your defenses for Azure cloud security.
Based on Microsoft’s documentation, we compiled a list of around 5,000 Activity Log events and descriptions, which you can find attached to the Community post linked at the end of this blog. As you discover more interesting events, put them into a LogRhythm List for comparison against the Vendor Message ID field.
Here are a handful that we found interesting:
Deleting Azure resources should be a normal occurrence in any environment, but spikes in this behavior may indicate an operational or security incident. Monitor the Common Event “Object Deleted/Removed” through a dashboard or AI Engine trend rule.
To filter a Web Console widget, use the Lucene Syntax: commonEventName:”Object Deleted/Removed”
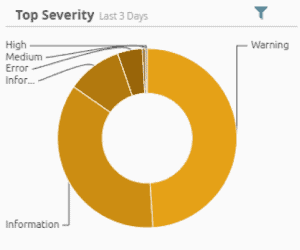
Similar to delete events, errors, and warnings, high-severity logs should be monitored for spikes. You can find this in the Severity field; look for values of “Critical”, “High”, and “Error.”
To filter a Web Console widget, use the Lucene Syntax: severity:(“Critical” “High” “Error”)
Figure 8: You can filter by the severity of specific events
LogRhythm’s CloudAI for UEBA is a great way to monitor user behavior and detect suspicious activity, especially from Azure Active Directory sign-in logs. In addition, LogRhythm enriches the log with geolocation information including country, region, and city to quickly identify where the request originated.
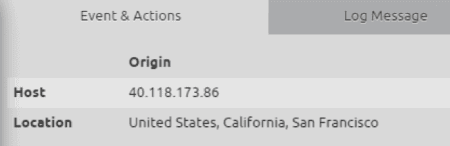
When an Azure service generates a request, you may not recognize the IP or region; there may also be no associated user.
Figure 9: An Azure Monitor Activity Log from an unknown IP
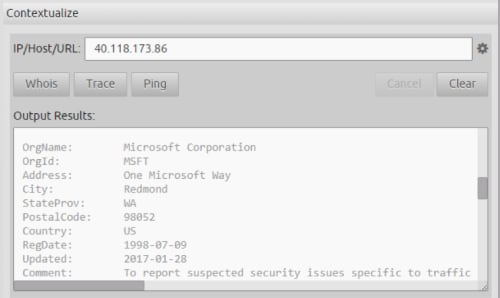
Figure 10: You can use the Web Console’s Contextualize capability to quickly Whois the IP address to confirm whether it belongs to Microsoft
Azure Active Directory underlies both Office 365 and Azure. You might already be bringing in Azure AD logs through the Office 365 Management API integration. These logs include Sign-In and Audit data, and follow a different schema than the Azure Monitor Activity Log.
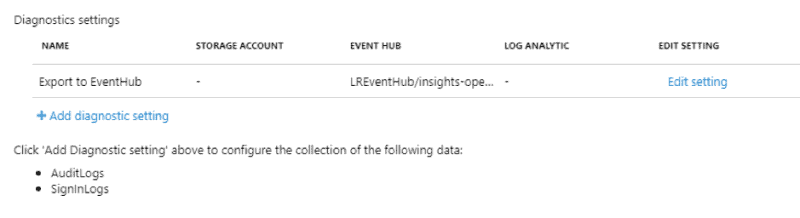
There are benefits to using the Azure Monitor integration, primarily a richer set of data in the logs. They fall under the Azure Monitor category of “Diagnostic Logs.” To enable, navigate to “Azure Active Directory” in the Azure Portal. Find “Diagnostic Settings” on the left menu and add a new Diagnostic Setting to stream “AuditLogs” and “SigninLogs” to your Event Hub.
Figure 11: Azure Active Directory AuditLogs and SignInLogs configured to stream to an Event Hub
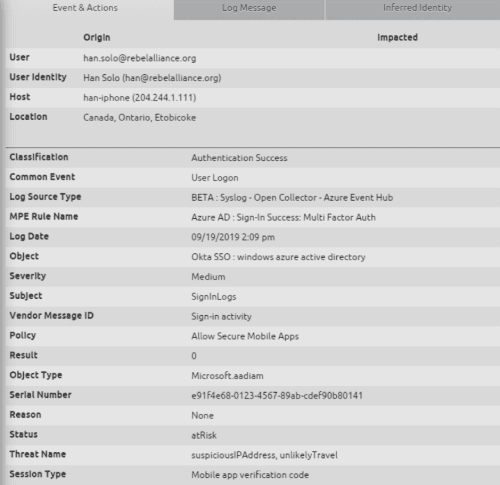
Here are some highlights from Azure AD sign-in log metadata:
Figure 12: Azure Active Directory Sign-In Log
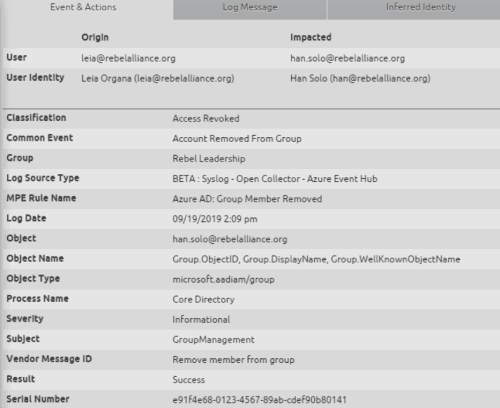
Azure AD audit logs provide visibility into user, group, service principal, directory, and tenant configuration changes. Unfortunately, many of these raw logs are missing the actor’s IP address.
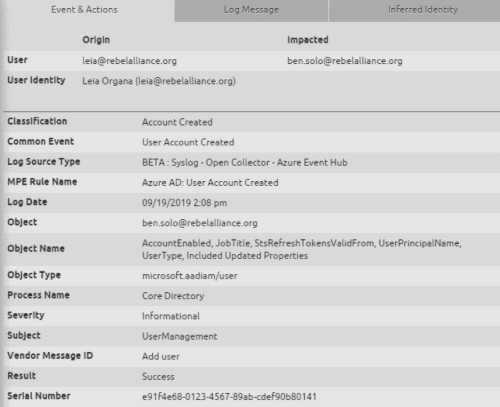
You can find a list of example events in the Audit Activity Reference documentation, but it is not a complete list, missing critical activities such as “Add User” and “Disable Account.”
Figure 13: Azure Active Directory Audit Log, where the user Han is removed from the group “Rebel Leadership”
Figure 14: Azure Active Directory Audit Log, where the user ben.solo is created
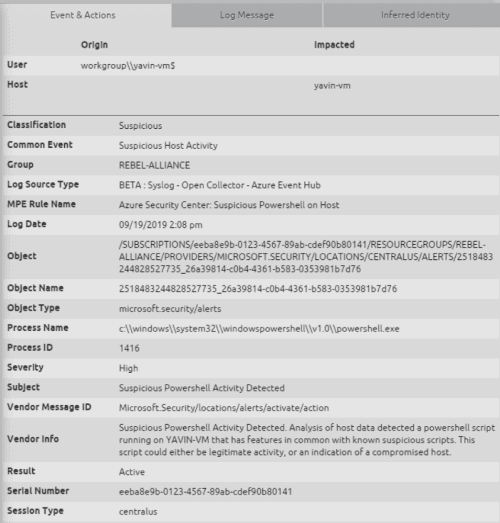
Azure Security Center alerts are part of the Activity Log, so if you’re auditing that, you’re likely already getting them in LogRhythm. When an alert is activated, you’ll get:
The log below is an alert generated when we ran Greg Foss’s Quick-Mimikatz on an Azure Virtual Machine.
Figure 15: An Azure Security Center Alert was activated, indication suspicious behavior on the host “yavin-vm”
You can bring these alerts into LogRhythm for a single pane of glass. Using AI Engine’s Log Observed rule block, create a primary filter for the Azure Event Hub Log Source Type and an include filter for a Vendor Message ID of “Microsoft.Security/locations/alerts/activate/action.” Group the rule block by Object.
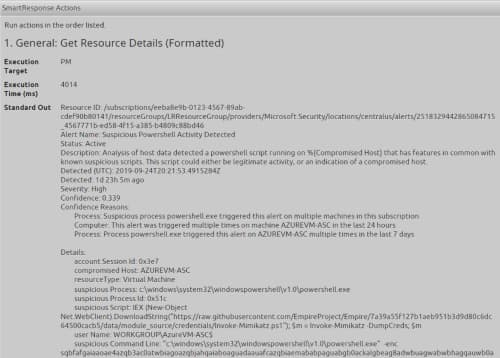
You can also leverage the SmartResponse automation actions to:
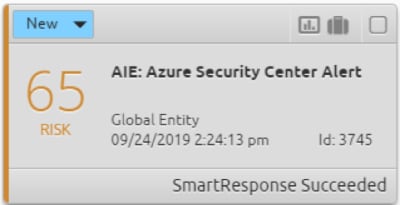
Figure 16: LogRhythm AI Engine provides a single pane of glass across your environment
Figure 17: LogRhythm SmartResponse automation attaches context about the Azure Security Center alert directly to the LogRhythm Alarm
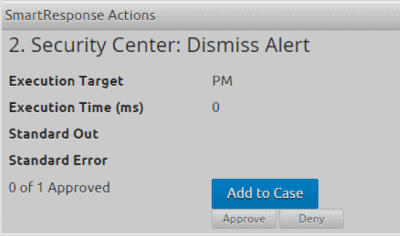
Figure 18: Once the investigation and response are complete, the analyst can approve a pending SmartResponse automation Action to dismiss the alert in Azure Security Center
Azure Policy is an effective way to audit and enforce controls within your Azure environment, analogous to AWS Config. There are a variety of out-of-the-box policies, as well as a few from the community, such as the Azure Monitor Onboarding policies built by Microsoft’s John Kemnetz.
Some examples include:
When an Azure Policy is violated, you’ll get a log with a Severity of “Warning” and one of the following Vendor Message IDs:
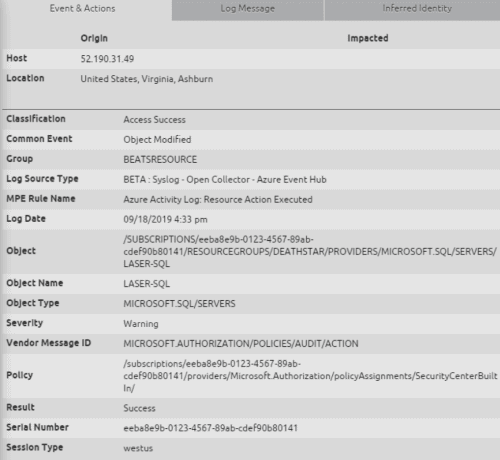
If you’re using Azure Policy to keep your environment secure, it is critical to closely monitor any modification or deletion of policy assignments with the following Vendor Message IDs:
Figure 19: An Azure “Audit” Policy was executed, but the audit failed (denoted by the Severity of Warning)
Azure EventHub provides access to a wide range of logs across many Azure cloud services. To assist your Azure cloud security efforts, LogRhythm’s Open Collector integrates with EventHub and provides collection and enrichment of Azure logs, enabling visibility, audit, threat hunting and enforcement across your environment. Gain the same level of visibility into your cloud computing resources as you have on your on-premises resources, and easily correlate activities as your users move across both traditional and cloud delivered resources.
If you’re a LogRhythm customer and ready to get started on your Azure journey, you’ll need to install and configure the LogRhythm Open Collector and EventHub integration.
More details, including documentation of both configuring Azure Monitor and the Open Collector, can be found in the Documentation and Downloads section of the LogRhythm Community here.
Additional resources from this blog can be found on the LogRhythm Community.
In our April 2024 quarterly release, LogRhythm Axon showcases new enhancements from its two week…
In our April 2024 quarterly release, LogRhythm SIEM introduces new enhancements to bring you faster…
Organizations face a significant obstacle: the cybersecurity skills gap. In fact, according to a recent…