The “Security Spotlight” blog series provides insight into emerging cyberthreats and shares tips for how you can leverage LogRhythm’s security tools, services, and out-of-the-box content to defend against attacks.
In this Security Spotlight, we’ll be talking about enhancing your reporting capabilities by integrating with Grafana.
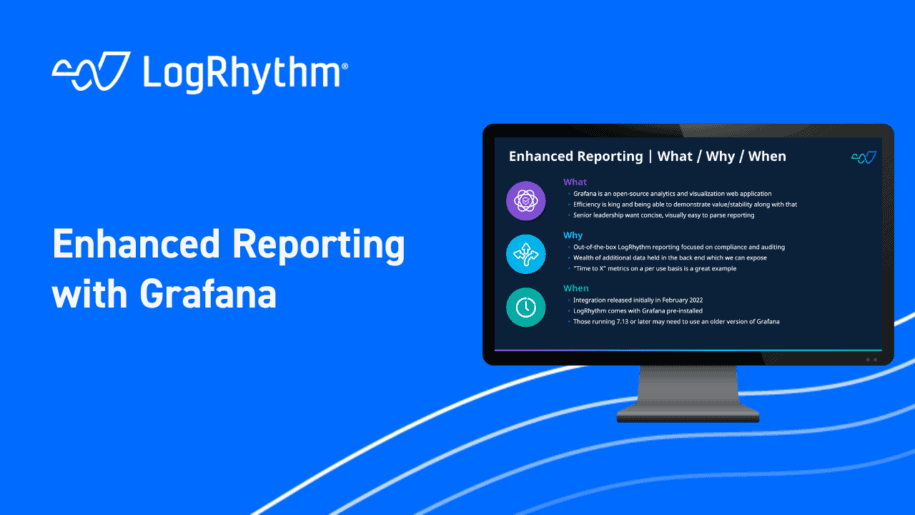
What is Grafana?
Grafana is an open-source analytics and data visualization web application that connects data sources and provides a high degree of flexibility in the way you can display your data. In today’s environment where efficiency is king, the ability to swiftly and clearly demonstrate the value and stability of your security monitoring platform has become essential.
While detailed reports laden with numbers remain relevant for those who know what to look for, senior leadership is increasingly seeking a snapshot view into how the SOC in which they have invested a great deal of their time and resources is progressing. In this regard, Grafana’s highly customizable view and its ability to output directly for reporting purposes are of great added value to the LogRhythm stack.
Why You Need Grafana
LogRhythm’s out-of-the-box reporting engine offers an extensive repository of content to assist in compliance and audit monitoring, which is a major component of most organizations’ SIEM requirements. However, there is an abundance of additional data that can be accessed by directly interacting with both the Elasticsearch and SQL back ends.
A prime example of this is the ability to surface a diverse array of Case Management metrics that are kept by the platform but not surfaced in the front-end dashboards. This includes all the most common “time to” metrics, which can be accessed and split by both priority and case owner, thereby empowering SOC managers with a greater ability to identify potential bottlenecks or areas of concern.
The integration we will be highlighting today was released initially in February 2022, though the tables and databases used by this integration have been accessible to LogRhythm on-prem customers from the very beginning. In fact, LogRhythm comes with Grafana preinstalled, offering a range of functionalities that can be leveraged such as health monitoring. This feature can prove invaluable when engaging with support to solve cases efficiently.
How Can LogRhythm Help You?
LogRhythm’s iMeta Sales Engineering Team has taken the lead in developing this integration, creating comprehensive documentation outlining the steps needed and a wealth of dashboards that any business can easily deploy after the initial setup is complete.
Once you’ve confirmed that Grafana is installed (which is typically done by default in most LogRhythm deployments), all you have left to do is ensure that the Elasticsearch, CMDB, and EMDB tables are reachable by the Grafana instance, and configure one additional view in the SQL database to simplify case reporting.
Today, one example dashboard providing substantial value to existing customers is the SOC funnel dashboard, which provides a real-world view of how RBP scoring and AI Engine rules narrow down the scope of investigations to reduce alarm fatigue. Another example dashboard, the Cases report, offers visibility into both overall response as well as analyst by analyst case stats.
For more information on how to enable these rules within your LogRhythm deployment, check out our community page to read more, download, and then import the rule into your platform.
For other Security Spotlight episodes, you can access the full playlist here.