Last year, during a proof of concept, a future customer discovered that an internal development web server had been accidentally published externally. The content of this development server—including the customers’ personally identifiable information (PII)—had been made publicly available with no authentication required, and the PII had been indexed by the Google search engine. Clearly not good.
Had the security team have been already using LogRhythm Network Monitor (NetMon), they could have picked this up way before they found all of their laundry airing out and indexing on Google.
How to Detect New Network Services
By utilizing network data generated by NetMon, the LogRhythm NextGen SIEM Platform can whitelist normal network behavior and can generate an alert when a new network service is detected. But in order to gather the complete picture you also need user and endpoint visibility. This brings us back full circle to the importance of holistic analytics.
Below I’ll discuss a real world example showing how holistic analytics can help you detect new network services and potentially avoid a similar incident.
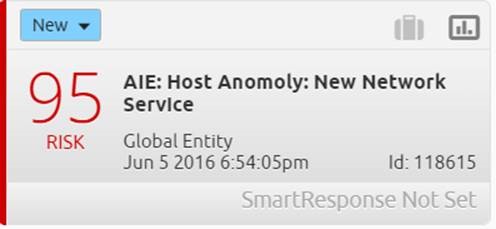
Here is an alarm for a new network service being discovered.
Figure 1: AIE Rule: Host Anomoly
This type of alarm is best suited for sensitive environments such as a DMZ, POS or high-security zones. This is especially the case in zones where new network services are not common place.
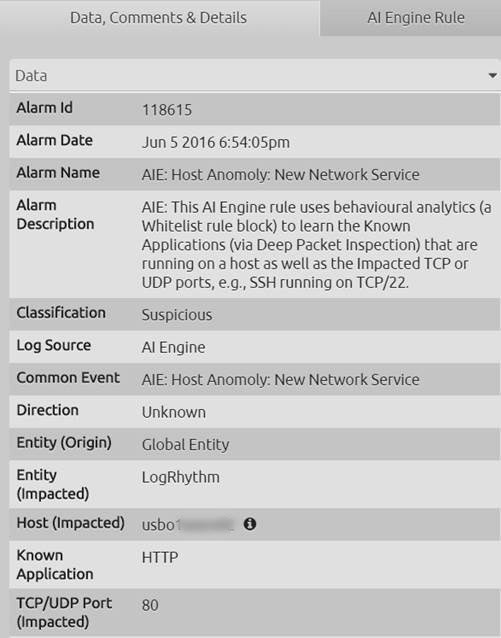
If you click the alarm card, LogRhythm will display the inspector panel. Here you can find a number of alarm details including:
- A description of the alarm to understand why it fired.
- The server that’s hosting the new network service. In this case the impacted host = USBO1SESRV02
- The newly detected network service. In this case the known application = HTTP (Note: that HTTP is an insecure plain text protocol, and ideally should not be used.)
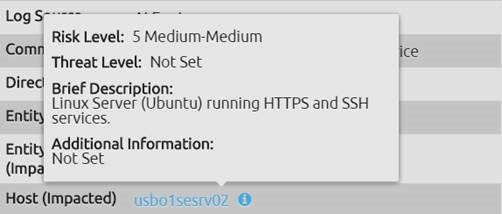
Further contextual intelligence can be gathered by hovering over the impacted host’s information icon.
Figure 3: Impacted Host Information
In this case, we find a Linux server that should only be running HTTPS and SSH services—not HTTP.
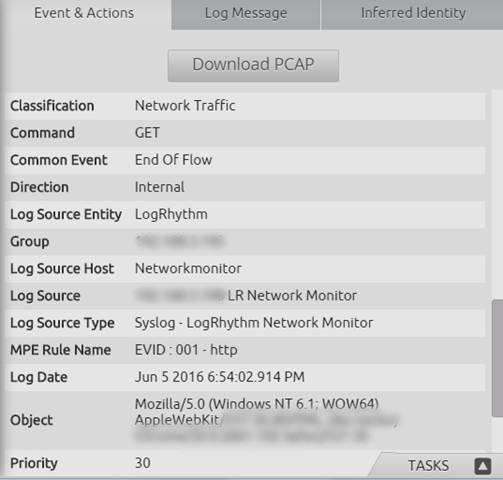
Drilling down into the alarm card reveals further metadata generated from NetMon, such as the HTTP activity and even the web browser that triggered this activity (Google Chrome).
Figure 4: Alarm Drilldown
The unified LogRhythm platform enables a one-click download of the raw packet data (i.e. Download PCAP button) for further analyst inspection, or otherwise attaching to a case.
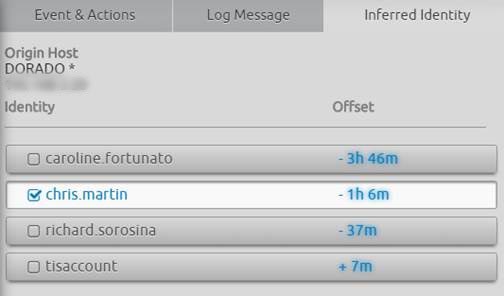
Often network devices’ logs do not include identity. But LogRhythm’s Identity Inference can reduce your overall time to respond by saving your analysts’ time in automatically displaying users who have authenticated on a host in question during the surrounding time frame.
Figure 5: LogRhythm Identity Inference
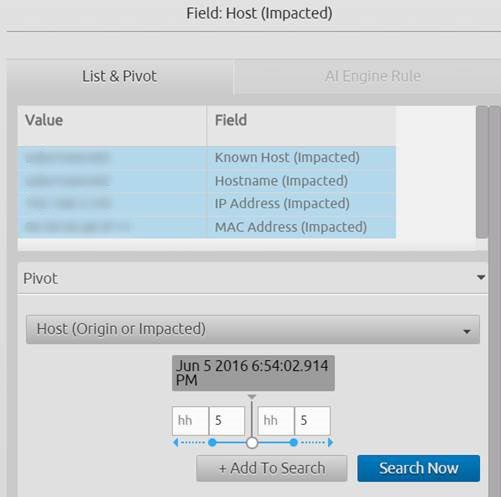
It is possible to drill down and search off of any metadata field within the LogRhythm Security Intelligence and Analytics Platform. So to further understand and validate what has happened, you can drill down on the impacted host for the surrounding five minutes before and after the new network service was detected.
Figure 6: Host Fields
The results of this search reveal a structured view of all activities on this host.
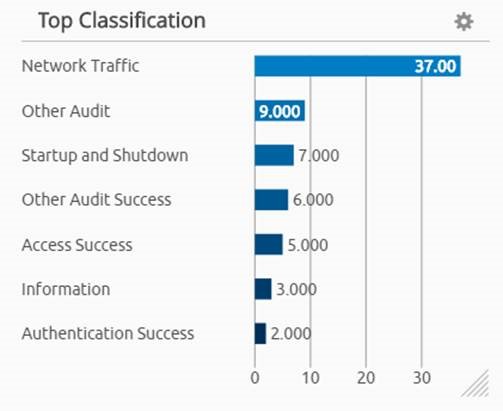
If you look at the ‘classification widget,’ it shows several areas of interest:
- Authentication Success
- Startup & Shutdown
- Access Success
Figure 7: Classification Widget
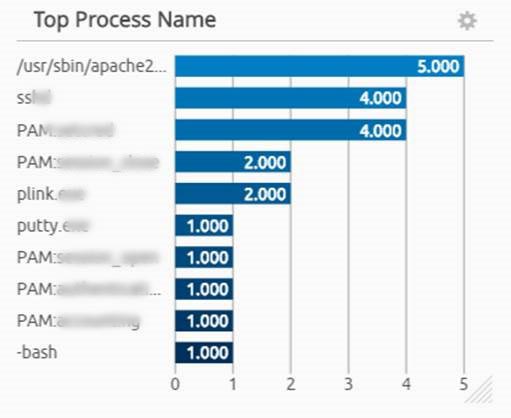
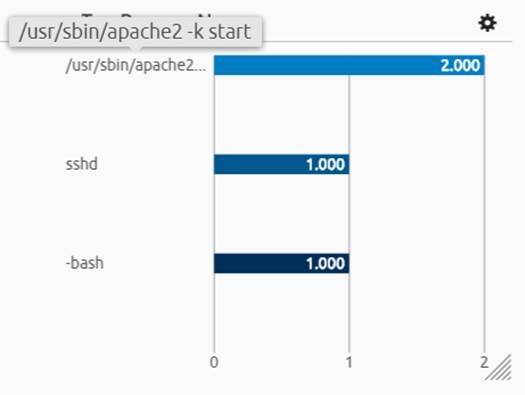
In another widget you can see the top processes that have been running or launched on the server currently running a new network service. We know the server is running a new network service thanks to LogRhythm’s endpoint agent process monitoring.
Figure 8: Top Processes Widget
One process that stands out is the Apache HTTP 2 process, which is a web server that can listen on TCP port 80 (as per our original alarm).
Utilizing the Breadcrumb trail feature, you can quickly filter the results.
By looking at the authentication success metadata, you can see the root user account has been used.
Figure 9: Authentication Success Metadata
If you apply another filter for the root user, you can view all processes that have been started (or stopped) by the root user.
Figure 10: More Authentication Success Metadata
This quickly reveals the Apache HTTP 2 service has been changed and started during this time window.
Figure 11: Apache HTTP 2 service has been changed
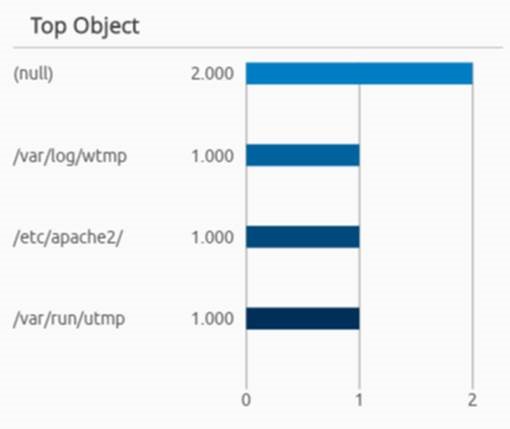
Further filtering reveals that configuration changes have occurred to the Apache HTTP 2 web server as well.
Figure 12: Apache HTTP 2 Configuration change
How Holistic Analytics Reduce Time to Detect and Respond to New Network Services
Several components of the LogRhythm security intelligence and analytics platform positively contribute to your ability to detect and respond to new network services rapidly. Here is a quick list:
AI Engine: Utilize behavioral analytics to learn normal network services (a whitelist rule block).
NetMon: Passively monitor all traffic flowing either north/south and/or east/west to detect new network services. Using deep packet inspection, be confident of the true application type being detected (no guessing like NetFlow).
Endpoint Analytics: Capture endpoint level activities such as configuration changes or processes/services being changed. In this case, by using LogRhythm’s endpoint agent process monitoring.
User Analytics: Identify and user behind actions, or when there is no identify utilize LogRhythm Identity Inference to save time on further manual correlation.
See this and other key use case demonstrations and discover the power of NetMon.
