
Anytime our team has been involved in a system migration, there has always been someone who claimed the new system was slower than the old one. In a recent case, the team had just completed the migration of a computing cluster from Amazon EC2 to Google Compute Engine (GCE). The deployment was automated using Terraform and Ansible, and the changes between the two cloud providers were minimal.
The migration itself went well and the cluster was operational in the new cloud provider without any immediate signs of trouble. But, of course, before the end of the week, we heard the first report that something was slower on the new system: Log messages seemed to be arriving at the Syslog server later than expected.
As we know all too well here at LogRhythm, timely delivery of log messages is not only important for production support. It is also essential for effective security monitoring. We had to discover what was causing the delay.
Diving Into the Root of the Problem
A quick check of the log files on the server confirmed they were arriving a few minutes late, and the problem seemed to be getting worse over time. Restarting the Syslog service on each node in the cluster cleared the issue temporarily, but invariably the problem would return after a short while.
We checked all of the obvious things. The Syslog server had plenty of available CPU and memory. The disk IO was low. The log volume wasn’t high. The network was healthy. We tried switching to UDP for log forwarding to avoid any potential issues with rsyslog and the TCP protocol. We also tried disabling log forwarding in various ways. Nothing seemed to help.
These were CentOS instances and the logging software was rsyslog, so we enabled the rsyslog debug log by passing the -d flag to the rsyslog service at startup. Unfortunately, once debugging is enabled, the log grows quickly. It is not considered a good practice to leave the rsyslog service running in this mode for an extended period of time, which was a problem for us because our issue wouldn’t recur until after the service had been running for a while.
Fortunately, there is a handy configuration directive available for the rsyslog.conf file that, once enabled, allows users to toggle debug logging by sending a SIGUSR1 signal to the rsyslog process:
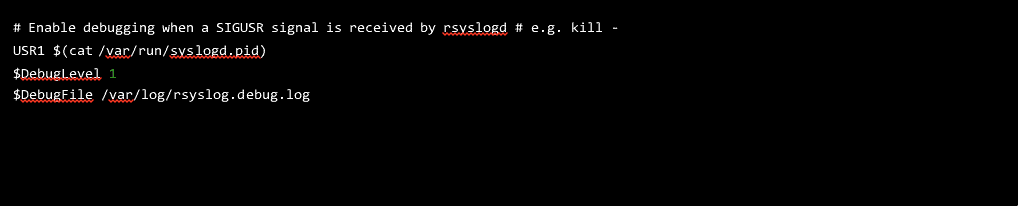
Figure 1: A rsyslog.conf file allows users to toggle debug logging by sending a SIGUSR1 signal to the rsyslog process.
Gaining Insights Through impstats
Unfortunately, the debug logs didn’t shed any light on our problem despite the lengthy output. We could tell at this point — just by instinct — that the main queue in rsyslog was not flushed quickly enough to deliver all of the messages, but so far, none of our logs contained any clues as to the cause of the problem. Some good statistics about the inner workings of rsyslog are available using a feature called impstats, so next we enabled that by adding the following to our rsyslog.conf:
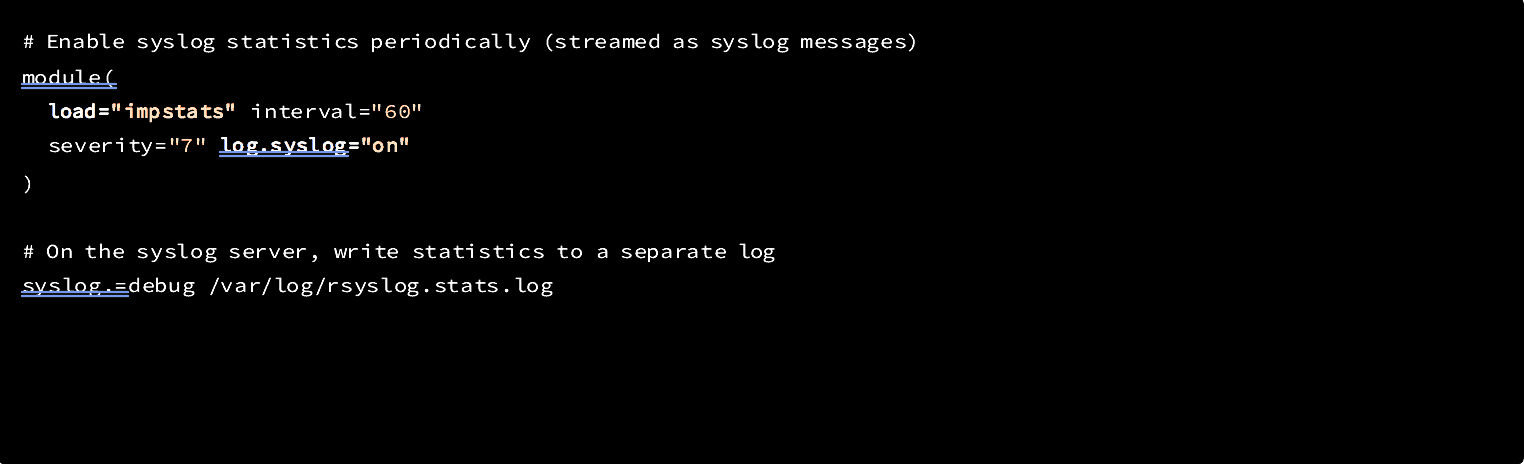
Figure 2: Enabling impstats
This provided some useful statistics about our Syslog queues, but unfortunately it only confirmed what we already knew: our rsyslog main queue was full and was not being flushed fast enough. This is evident in the stats output when the size field becomes large. We were seeing tens of thousands of messages get stuck in the main queue as it continued to grow: 
Figure 3: Tens of thousands of messages get stuck in the main queue as it continues to grow
Isolating the Problem Using Named Queues
Searching the web for clues turned up a discouraging GitHub issue that seemed to describe a similar issue to ours with no obvious explanation or solution. Convinced that this must have something to do with our log forwarding rules, we setup named action queues to see if we could isolate exactly where in the Syslog message delivery the messages were getting delayed. To do this, we translated the Syslog configuration we had for log forwarding that looks like this:  Figure 4: Translating the Syslog notation for log forwarding
Into the much longer form that looks like this:
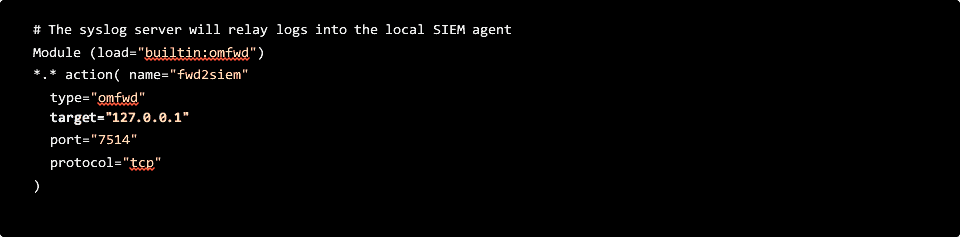 Figure 5: Translating the Syslog notation for log forwarding
However, none of the named action queues we created isolated the problem, the main queue was still not being flushed fast enough to deliver the messages on time.
Reviewing the Configuration Line-by-Line
Finally, out of desperation, we started combing through the rsyslog.conf file line-by-line — searching for anything that might explain the issue. We knew the config file had not changed during the migration, but there had to be a clue in there somewhere. Then we noticed this:

Figure 6: $IncludeConfig directive
Sure enough, there was a file on the system that matched the pattern:
 Figure 7: Google config file applied to every log message handled by the Syslog server, flooding the device
Was this our problem?
We confirmed our suspicions after we removed this directive from the configuration. Our logs caught up and everything started working again.
Returning to Normal Operations
So, why did this happen? On most servers, the above configuration for Syslog is fairly innocuous. Kernel and daemon logs on an isolated CentOS instance are generally rare enough that not many messages are reported to /dev/console.
This log directive is also useful because it provides a way to troubleshoot unresponsive servers by connecting to the serial port in the GCP console to view recent activity.
In our case, this configuration caused a major disruption in log delivery. Because, by default, the $IncludeConfig directive is near the top of the rsyslog.conf file, the setting provided by the Google config file applied to every log message handled by the Syslog server. In this instance, because our Syslog server was receiving logs from many different systems, the console device was flooded with more messages than it could handle.
How many messages can it handle? The answer is 38400 baud. This translates to about 4K per second! To see this in action, run the stty command against the /dev/console file:

Figure 8: Running the stty command against the /dev/console file
That certainly explained the delayed log delivery! The flood of logs going to the system console were limited to 4K per second, and because these logs were on the main Syslog queue, the entire server was limited to 4K per second, as well.
We might have caught this earlier in our troubleshooting by setting a named action queue on the log configuration for /dev/console, but because we didn’t realize this configuration was here in the first place, we never had the chance.
A named action queue in this case presumably would have spared the main Syslog queue from getting clogged with messages destined for the console by creating a new queue. From there, we could have also configured Syslog to discard messages for the new queue if the console couldn’t flush the messages fast enough. For our purposes, we just disabled this configuration completely and our Syslog server has been working great ever since.
Every time our team is in a system migration, there’s always something that runs slower…