The Challenge
Tough times call for tough measures. What better way to visualize those measures than through the cyber kill chain?
The Cyber Kill Chain is a method developed by Lockheed Martin to gain further insight into what stage a cybercriminal is at in an attacking cycle.
- Reconnaissance
- Weaponization
- Delivery
- Exploitation
- Installation
- Command and Control
- Action on Objectives
The Solution
The first thing you have to understand is the steps that compose the Cyber Kill Chain. Once you have the basics of what each step consists of, you can accurately customize the widgets in LogRhythm to show at each data step.
Optionally, at each phase, you could implement a SmartResponse™ to give fuller correlation capabilities. For example, at the Reconnaissance phase, you would add the Origin and Impacted IP address to lists to more accurately see what a campaign is targeting against specific assets in a customer’s environment.
This would allow you to add more resources: patching, access control lists, vulnerability management practices, and so forth in preparation of a targeted attack.
Technical Configuration
To make sure you are getting the proper items coming into the dashboard, you will need to make sure you are collecting at a minimum some of the below items. This is not a comprehensive list, but it will definitely get you started in the right direction in terms of having this data populate in your dashboard. The dashboards are completely customizable, so if you need to add or modify widgets to your environment, just be cognizant of the type of log source you might need to detect a specific activity.
| Cyber Kill Chain Step | Log Source Collection Examples | Description |
| 1: Reconnaissance | Firewall, IPS/IDS, LogRhythm NetMon | These types of log sources can pick up on port scanning within your environment. If you want to detect lateral movement within your organization, it is recommended that you tap/span traffic at your access and distribution switch layers as well. |
| 2: Weaponization | Firewall | This will give you a good indicator right away that there may be some foul play on your network (even though IP addresses can still be spoofed—if you are seeing communication with Antartica, this might be something to investigate further.) |
| 3: Delivery | Firewall, IPS/IDS, LogRhythm | These types of log sources can be configured to alert you of an impending DDoS attack. For this section in the dashboard, I included Delivery and Attack Failed as well. You can use this widget to see how the attacker is trying to deliver a specific payload that might repeatedly fail. Once you have this information, you will have a good idea of how the attacker is trying to infiltrate your network. This would also be a good spot to create an AI Engine rule to look at Attack Activity Failed followed by an Authentication Success/Network Allow. |
| 4: Exploitation | Firewall, IPS/IDS, vulnerability scanners, Windows/Linux log collection | You can use this series of widgets to be alerted of interesting exploitation activity, get notified of commands being run on endpoint systems, and use known vulnerabilities to fortify your network. |
| 5: Installation | Antivirus, DLD, FIM, RIM, Windows/Linux logs | At this stage, you will want to leverage all log sources that give you any indicator of installation activity on your systems. If you want to go the extra mile, create a SmartResponse to kill unknown processes should they activate. |
| 6: Command and Control | IPS/IDS, firewall, Netflow | The network components of logs collected here will alert you to specific communication that is abnormal on your network. Additionally, if you see an abnormal amount of external activity, this might be indicative of large amounts of data being exfiltrated from your network. |
| 7: Action on Objectives | Active Directory, DLD, DLP, FIM, LDAP, LogRhythm NetMon, Netflow, RIM, Windows logs | This is where any logs related to behaviors in user accounts, file transfers, network activity, and so forth, will help you to determine what an attackers is trying to accomplish. By this stage, you should already have a good understanding of what is being targeted in your environment. |
Editing a Widget
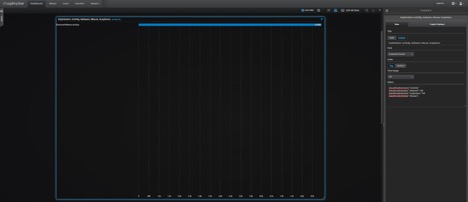
To edit a widget, click on the widget you want to change by selecting the gear icon in the top right. From here you can see the Where section I specified my own classification types to make this widget display very specific information.

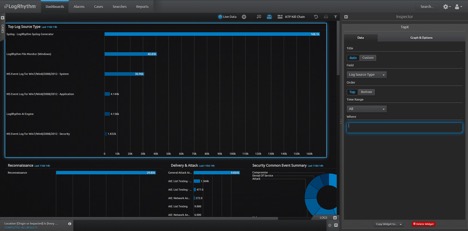
Alternatively, you can change the Field to “Log Source Type” and specify what log sources you want to see.
In the image below, you can see the Log Source Type displays all log sources that you are bringing in:

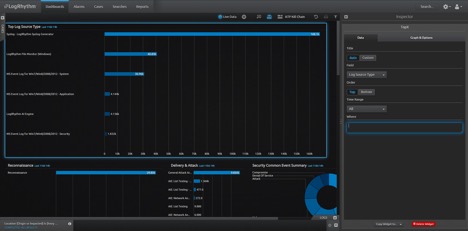
In the After image, you can see that you are adding only the log source types that you want to see. (In this example, you are adding specifically the Windows System and Security log types.)

If you don’t know the syntax for the particular field you are trying to filter on for the “Where” section, start out by performing a drill down on the specific Log Source Type and then select your Filter icon in the top right. This will display the information you can use in your “Where” field when examining specific log sources. You can apply this same logic to sequentially add all the items you might find relevant for a particular step in the Cyber Kill Chain.
The Value
With each step of the Cyber Kill Chain, you can accurately show logs from each step with LogRhythm—giving you a quick, at-a-glance dashboard to see what stage a threat is at in your environment. Being able to visualize these steps quickly greatly reduces the time to detect and respond to an incident—so your SOC can spend more time doing and less time searching.
See how LogRhythm can help you to detect insider threats at every stage of the cyber kill chain with User Behavior Analytics.