The recent Log4Shell (CVE-2021-44228) vulnerability is the impetus to creating this blog and discussing how you can use LogRhythm AI Engine (AIE) “Trend rules” to effectively detect anomalous behavior. This approach can likely be used in other technologies outside of LogRhythm, too. However, the focus will be around how LogRhythm trend rules can detect anomalous or “new” events, and enable an analyst to threat hunt anomalous DNS and LDAP activity. For details on LogRhythm trend rules, please visit LogRhythm’s Docs here.
LogRhythm has also created several resources for the Log4Shell vulnerability, where we discuss novel approaches to detecting some of the attack vectors observed. You can learn more about what the Log4Shell vulnerability is and how to detect it here:
- CVE-2021-44228 Log4Shell Detection
- Detecting Log4Shell with MistNet NDR and NetMon
- Let’s Discuss Log4J
How Trend Rules Help Detect Anomalous DNS and LDAP Behavior
Before we cover how you can leverage trend rules, I will illustrate a typical analyst threat hunting workflow without the use of trend rules:
Using the Log4Shell threat reports, an analyst learns that an attack vector leverages rogue DNS and LDAP servers to download malicious content to a vulnerable Log4J server. The analyst performs a search of DNS and LDAP activity over several days looking for anomalous behavior that would indicate a compromise. Threat hunting and retrieving DNS and LDAP logs results in a massive amount of log data that the analyst must manipulate for signs of anomalous behavior. It’s likely that the majority of log data is similar, and the analyst really needs to understand if there is an anomalous connection. The analyst will perform this search and data analysis several times over the coming days to look for that connection. This type of threat hunting is not conducive to detecting anomalies quickly, plus observations may be missed due to the sheer volume of logs being analyzed.
This is where a trend rule comes in and creates an event focused on anomalous or “new” activity. The anomalous events generated should be rare in a known environment like servers running Log4J. In this scenario, when the analyst is threat hunting for anomalous application use involving DNS and LDAP, they can look at LogRhythm’s WebUI dashboard for recent anomalous events, as well as be able to search back further in time for anomalous trend events. The analyst can search further back in time and find anomalous activity quicker as the trend rule will contain a small fraction of the overall log data and will contain the valuable “rare” or “new” observations. These unique observations will only event the first time they are seen over a 30-day period. As an added benefit of capturing the first observed activity, the analyst quickly identifies when the activity began, thus reducing the time spent threat hunting and reducing the time to detect the compromise.
A word of caution when using trend rules in AIE: trend rules can consume a large amount of memory depending on several factors, but most notably, log volume, and evaluation frequency of the rule. We recommend testing trend rules before deploying in a production environment.
Threat Hunting Walk-Through Using Trend Rules
The following are examples of how an analyst can action trend rule events for anomalous detections and determine if a compromise is likely. This threat hunt is inspired by the Log4Shell vulnerability where rogue DNS and LDAP service were used. The trend rules and dashboards discussed in this blog are available for download in the “Downloadable Content” section.
Threat Hunting Known Application: DNS
In this demonstration, threat hunting will be a focus on AIE observed events that contain a DNS port, or application being identified, so I’ll use the WebUI dashboard “Known Application:DNS” to start with. I will also primarily focus on using the AIE rule named “Rare known application:DNS”. You will need the AIE rule “Rare known application:DNS” active for at least 24 hours prior to performing your own threat hunt. This threat hunt starts with a premise based on the recent Log4Shell attacks where attackers were using rogue DNS servers to provide a malicious payload to victim systems.
The following are steps I will take to determine if a threat is present. A hypothesis of the threat hunt is that compromise is unlikely because we don’t have any vulnerable Log4j running in our environment that we know of. Although the threat hunt demonstrates that compromise is unlikely relating to Log4Shell attacks, the threat hunt is still valuable because you can prove to management and auditors that you have the visibility and assurance in place to prove that compromise is unlikely.
During a threat hunt, you may find a different kind of threat that will require further investigation. This typically involves a forensic approach on an endpoint to determine if initial suspicious activity, is in fact malicious, a false positive requiring tuning of security rules, or is a potentially unwanted application (PUA) (many security companies identify PUAs). For more information on what a PUA is, feel free to check out this description from Sophos,
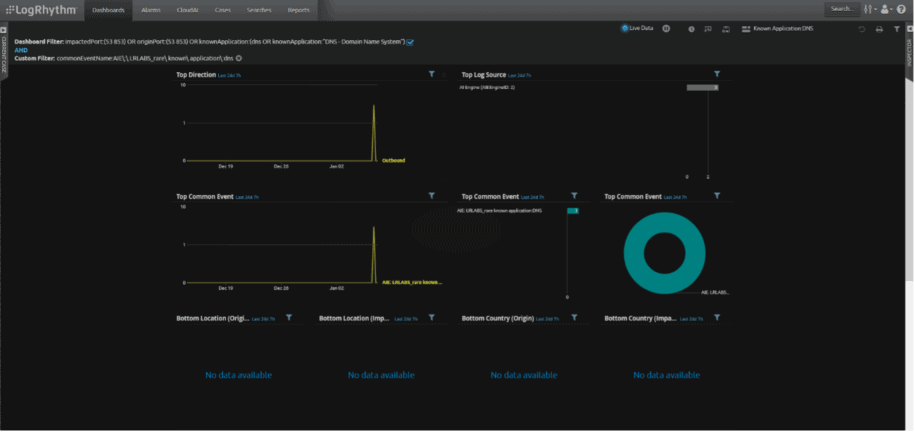
- Using the WebUI “Known Application:DNS” dashboard, filter the dashboard for “commonEventName:AIE\:\ LRLABS_rare\ known\ application\:dns”.
- For more on how to perform WebUI searches, refer to the WebUI help and documentation here.
- When I apply the filter, my dashboard looks like this:
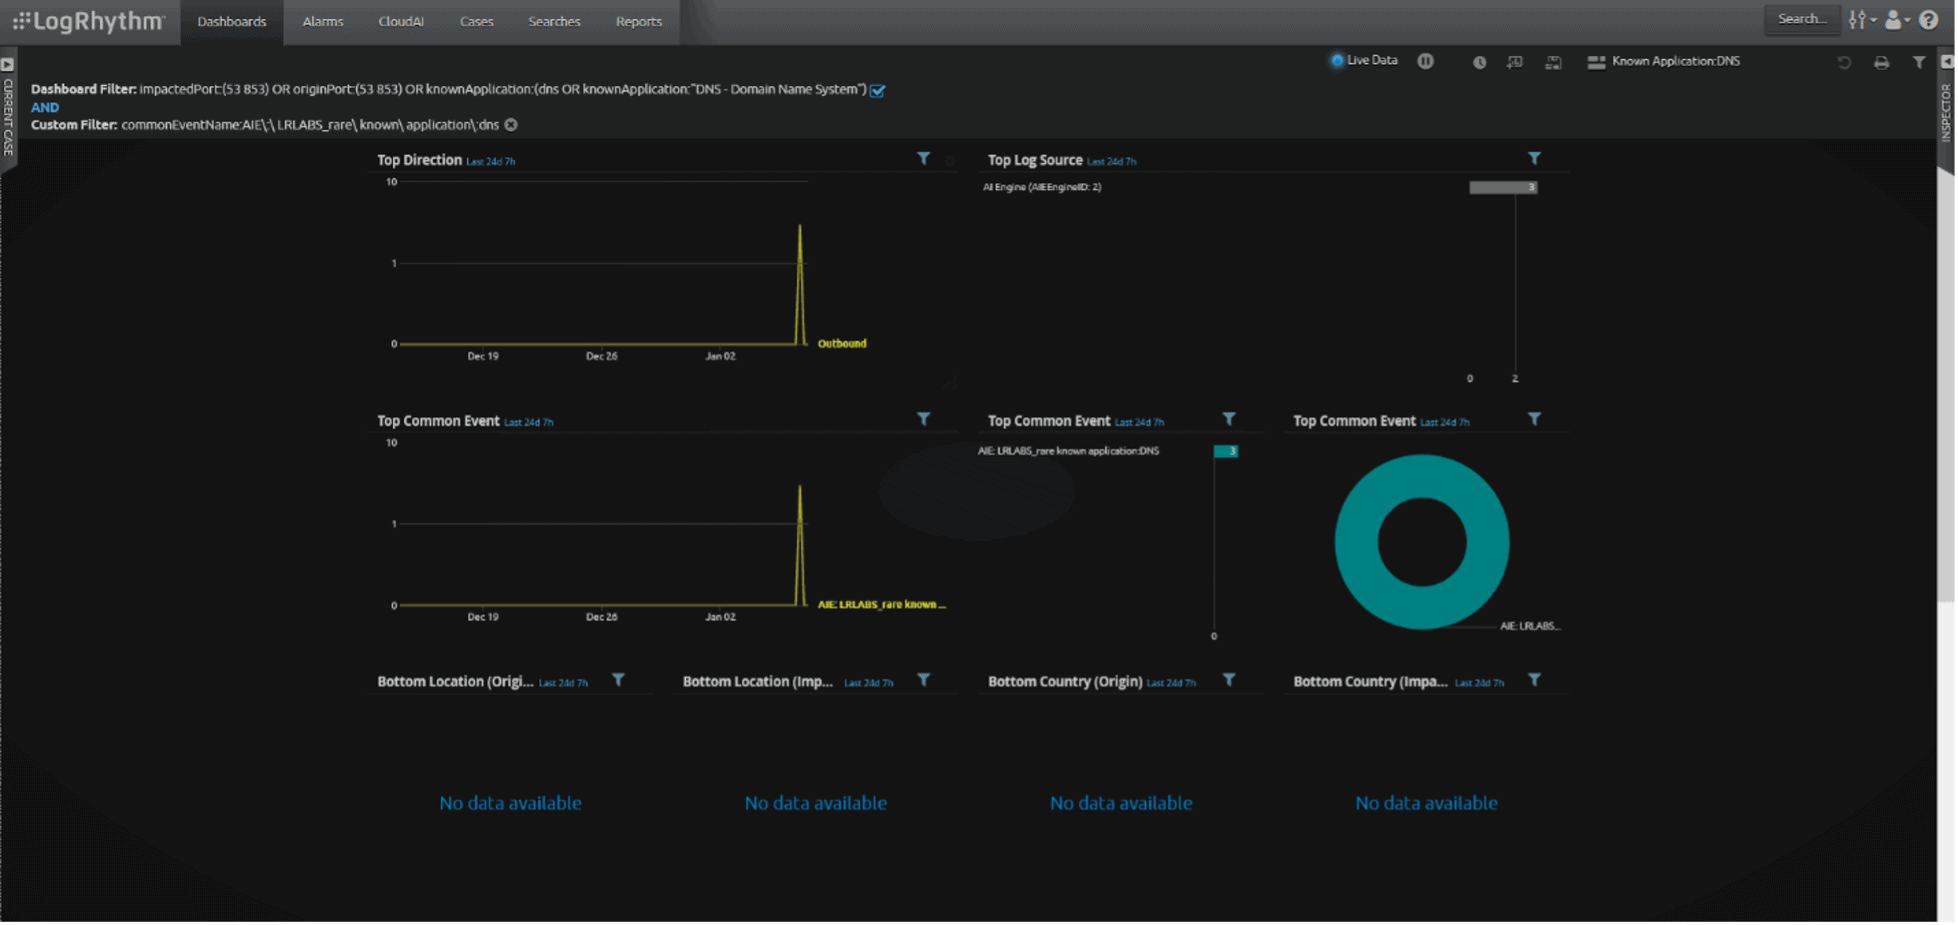

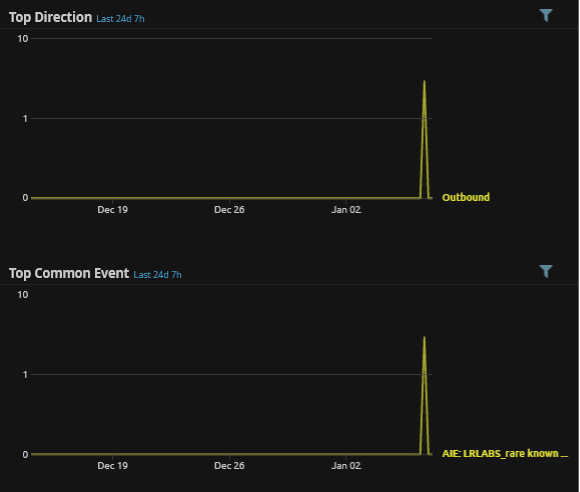
- First, you will notice that event displayed has a direction of “Outbound.” Depending on your environment, it is most likely that non-DNS servers do not reach out to the internet for DNS queries. Instead, they typically use an internal DNS host. Seeing outbound DNS activity is suspicious in this case.
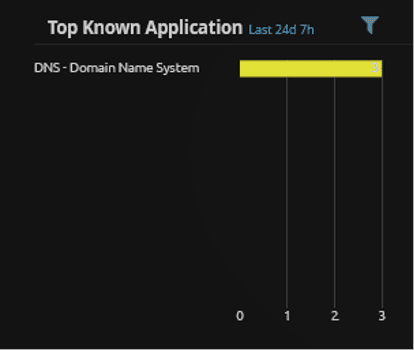
- Look for any unexpected applications in the “Known Application” widgets.
- In the screenshot below, “known Application” lists applications we expect to see like “DNS” and “DNS – Domain Name System.” In this case, we see the application being identified correctly, so it’s likely “DNS” activity, which makes this event less suspicious.
- In the Node Link Graph, we can see one system (circled in red in the screenshot below) communicating with two other DNS services. The two DNS IPs are 1.1.1.1 and 8.8.8.8. Before 2018, systems trying to communicate with 1.1.1.1 would be considered suspicious. See this presentation from Carnegie Melon University (CMU) titled, “Detecting Traffic to Recently Unparked Domains with Analysis Pipeline,” in which 1.1.1.1 is called out as an indicator of a parked domain. Since 2018, Cloudflare is using the IP address for private and secure DNS resolution. 8.8.8.8 is Google’s DNS. Knowing that both IPs are legitimate DNS resolvers, and likely being used legitimately, the events are less suspicious.
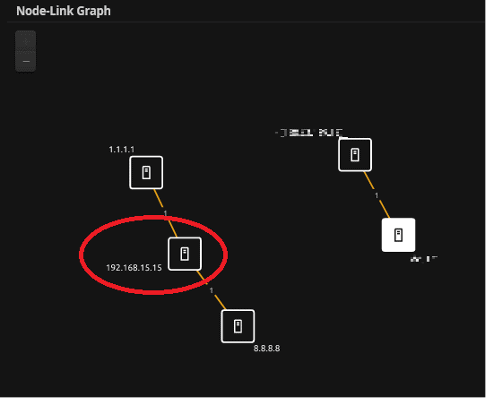
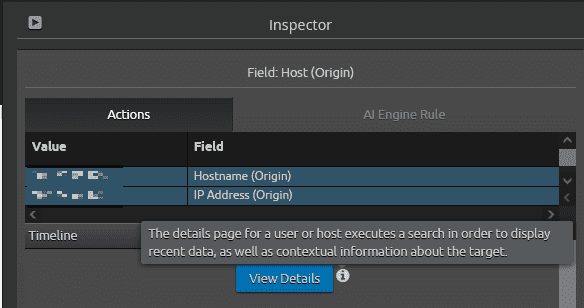
- The IP address of 192.168.15.15 is not a known system and is communicating to the internet to resolve DNS, so as an analyst, I would like to find out more about that system. I will then click on the one system to further my investigation. Clicking on the system will invoke the “Inspector.” From here, I will click on “View Details” (The details page for a user or host executes a search to display recent data, as well as contextual information about the target.) to further investigate this system and determine if it’s a threat.
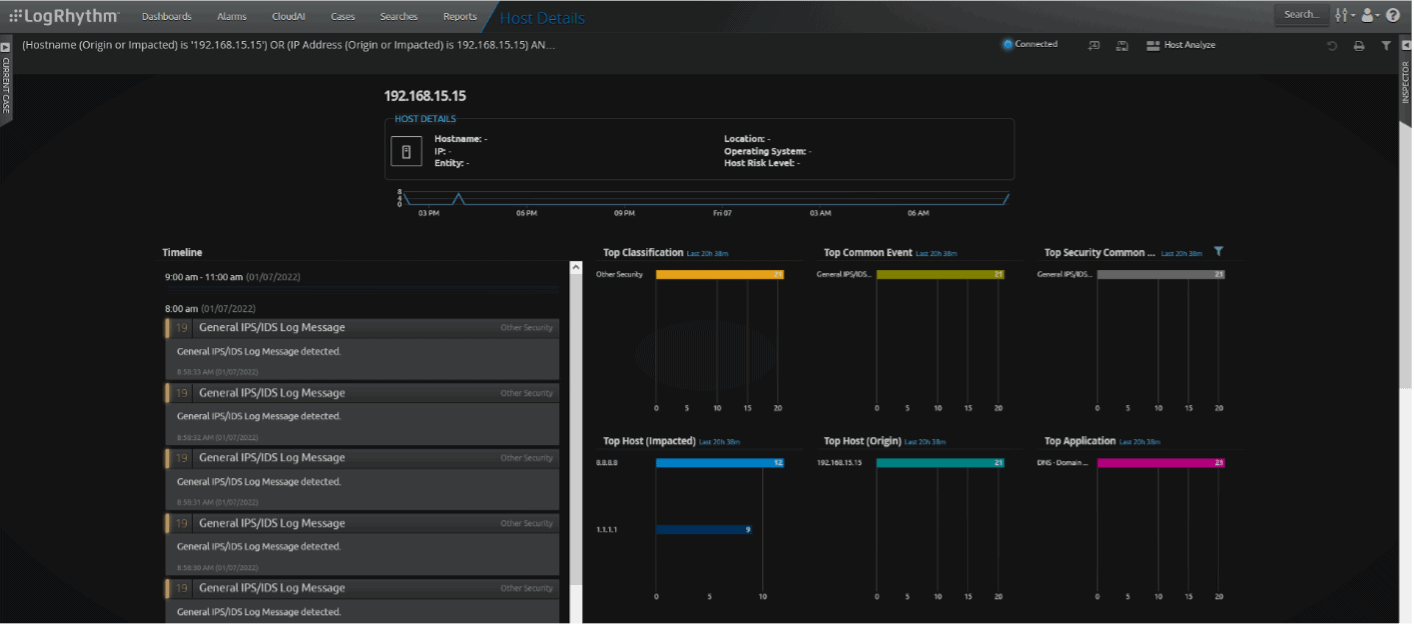
- The details and timeline view allow me to quickly identify that the system is triggering IDS events of interest, and looking at the frequency of the events, it may seem like beaconing traffic which is suspicious.
Clicking on the event in the timeline will open the Inspector window with more details around the observed event, giving the analyst more information to determine if the events are suspicious and require further action.
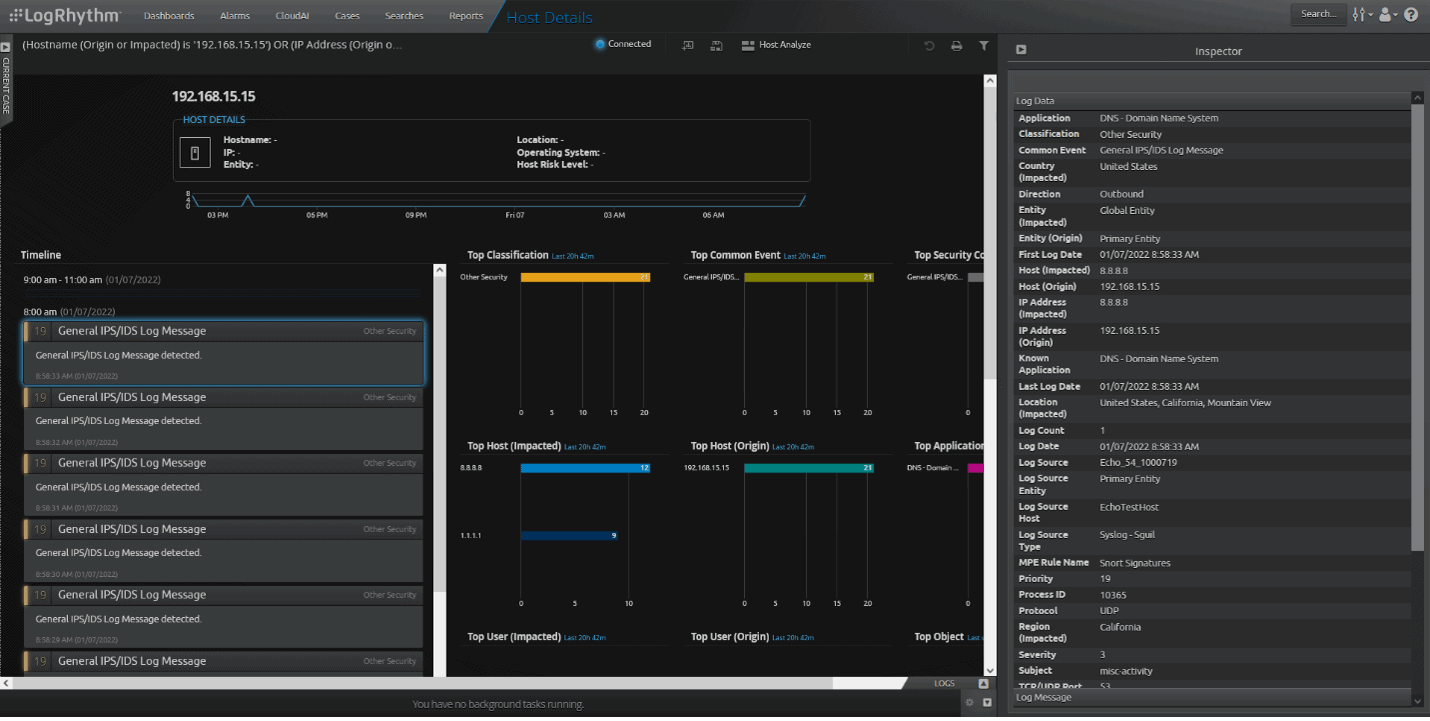
In the Inspector pane, we can see the log source type (Syslog – Sguil), and that it was a Snort signature detection (MPE rule name), named “et info suspicious null dns request” (Threat Name). An analyst could look up (using Google) the threat name to get a better understanding as to what the rule detects like from Proofpoint, or by looking at other results like from Any.Run that has a sample that also triggered this detection rule. I don’t have any information other than this detection could be associated with malicious activity based on what additional information I found, and that I don’t see other systems behaving in this manner. At this point, I would issue a smart response to isolate the system on the network until a more thorough forensic investigation can take place to determine what processes actually made the DNS requests.
The threat hunt is now complete, and although there were no signs that Log4Shell compromise occurred, we did find suspicious activity that should be followed up on.
Threat Hunting Known Application:LDAP
Threat hunting in this demonstration will be a focus on AIE observed events that contain a LDAP port, or application being identified, so I’ll use the WebUI dashboard “Known Application:LDAP” to start with. I will also primarily focus on using the AIE rule named “Rare known application:LDAP”. You will need the AIE rule “Rare known application:LDAP” active for at least 24 hours prior to performing your own threat hunt. This threat hunt starts with a premise based on the recent Log4Shell attacks where attackers were using rogue LDAP servers to provide a malicious payload to victim systems.
The following are steps I will take to determine if a threat is present. Similar to the DNS threat hunt, a hypothesis of the threat hunt will be that compromise is unlikely due to we don’t have any vulnerable Log4j running in our environment that we know of.
- Using the WebUI “Known Application:LDAP” dashboard, filter the dashboard for “commonEventName:AIE\:\ LRLABS_rare\ known\ application\:ldap”
- For more on how to perform WebUI searches, refer to the WebUI help and documentation here.
- When I apply the filter, my dashboard looks like this:
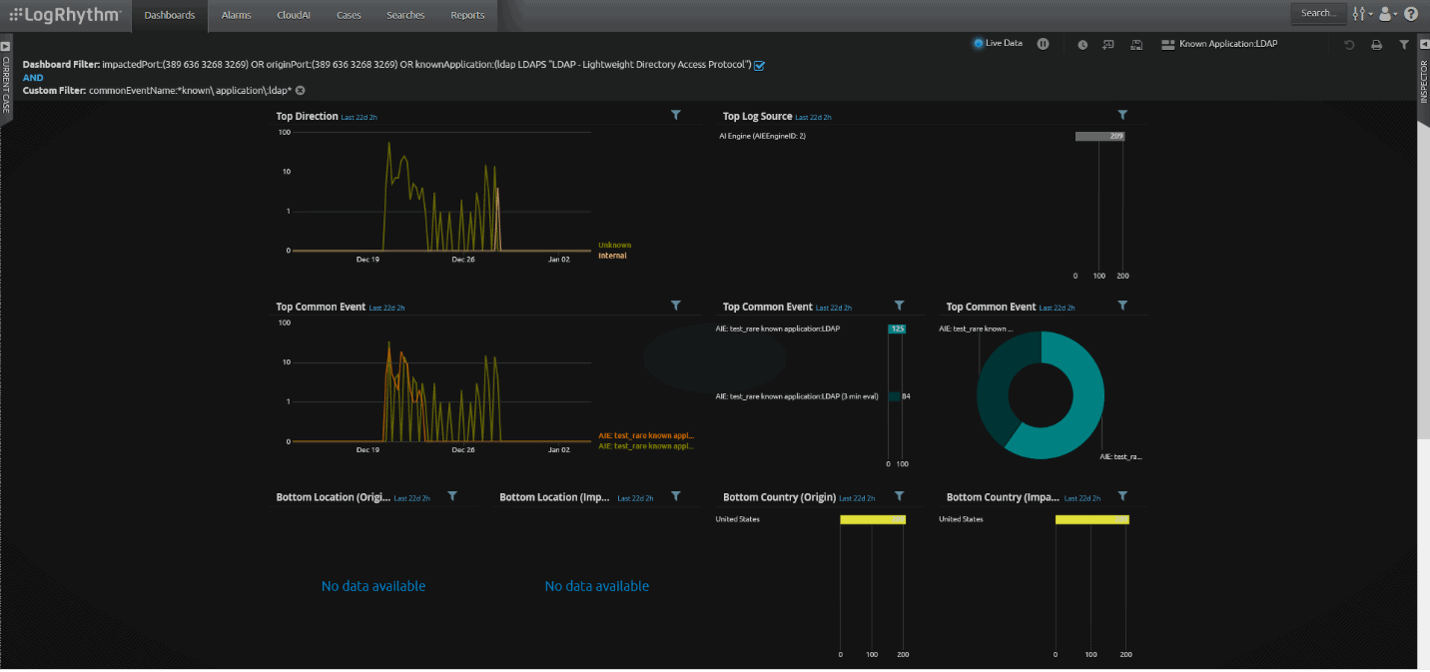

- Look for any unexpected applications in the “Known Application” widgets.
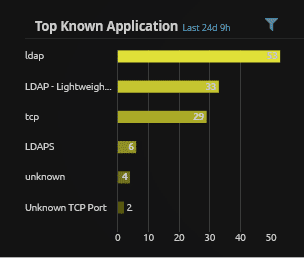
- In the screenshot below, “known Application” lists applications we expect to see like “LDAP”, “LDAPS”, and “LDAP – Lightweight Directory Access Protocol.” Seeing other applications being identified like “TCP” or “Unknown” are interesting and suspicious in nature. I’ll filter in on the application “Unknown TCP Port” to continue the threat hunt.
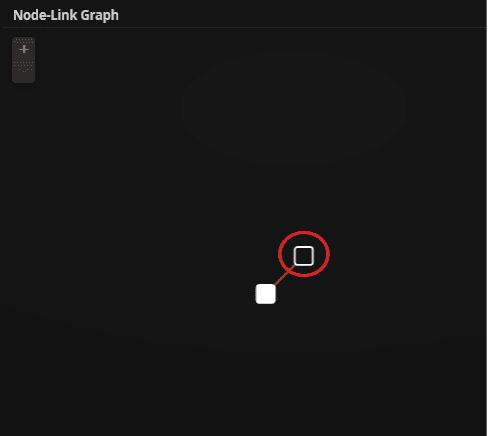
- In the Node Link Graph, we can see one system (circled in red in the screenshot below) communicating with one other systems.
- I will then click on the one system to further my investigation. Clicking on the system will invoke the “Inspector.” From here, I will click on “View Details” (The details page for a user or host executes a search to display recent data, as well as contextual information about the target.) to further investigate this system and determine if it’s a threat.

- The details and timeline view allow me to quickly identify that the system in question is a known vulnerability scanner. I can add this IP and known system to the exclusion list in the AIE rule so that this known activity will not show up in future detections.
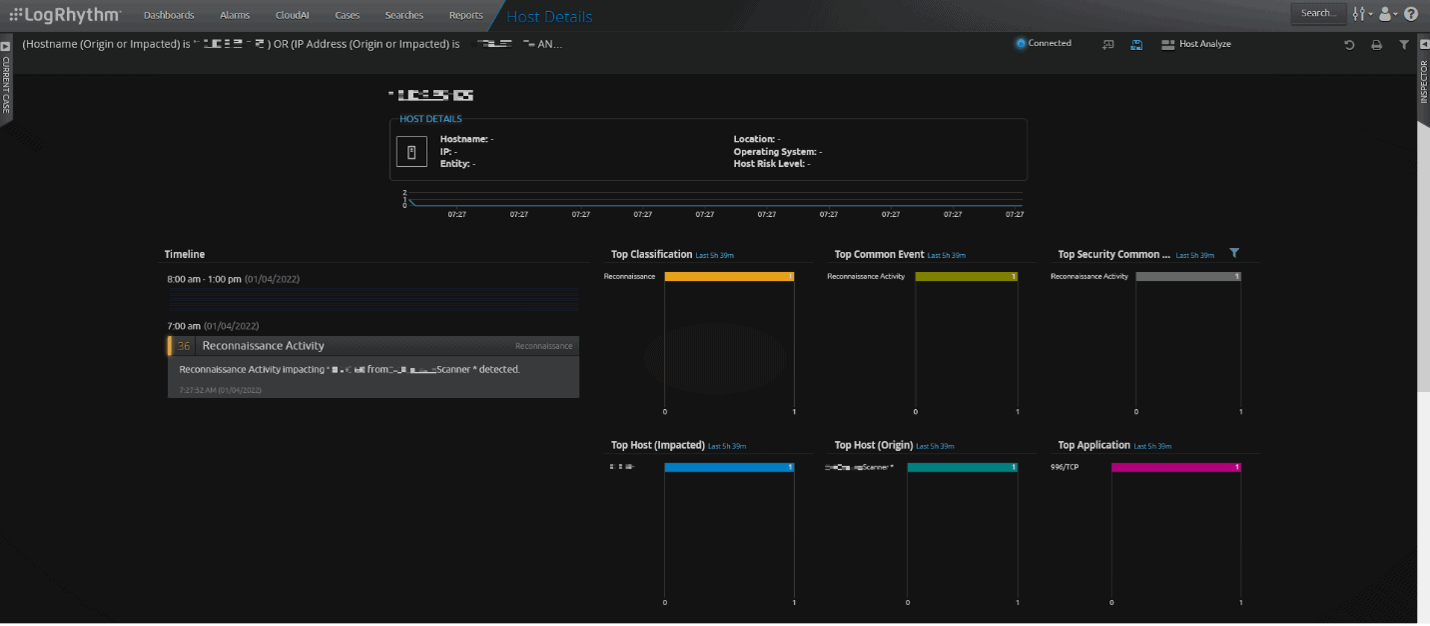
The threat hunt is now complete, and no threat was found. I did find suspicious activity quickly and was able to determine that the suspicious activity is in fact known and authorized. This threat hunt example is meant to show how valuable trend rules are to quickly determine what’s “normal” in your company and reducing the amount of events to investigate to a reasonable and actionable amount.
Note: When activating a trend AIE rule, it will likely event on known authorized activity like security tools scanning your environment. You may want to exclude known vulnerability scanners and other known tools that would otherwise cause the rule to event prior to activating the rule. There’s no harm in allowing the rule to event on known activity. Just be aware that the rule will initially detect everything as “new” as the rule is newly deployed in your environment. Another option is to use the “Pause” feature for the rule, in which the rule will be active and build up a baseline for as long as the pause is set and will not event. This will reduce the amount of known activity events, however, may also not event on rogue activity occurring during this time period. I recommend letting the rule event on everything “new” and to become familiar with what activity is occurring in your environment.
Threat Hunting Known Application:LDAP (Using all relevant events)
Using trend rules or any “new” rule is great for future detections. But what about retroactively looking for events that might be associate with the Log4Shell attacks? I will now demonstrate how you can use the WebUI dashboard “Known Application:LDAP”, and look for events that have triggered over time to determine if compromise is likely or not.
Note: As I work through this scenario, you may see AIE events that you do not have enabled in your environment. You may want to consider enabling those rules too for future threat hunts.
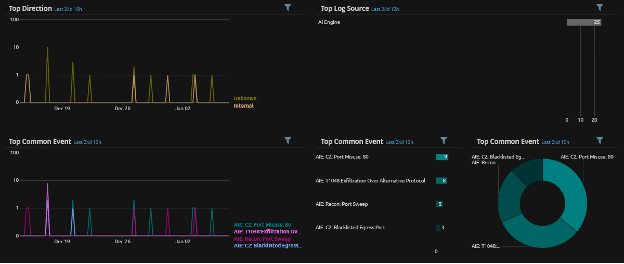
- The first thing I notice when looking at the dashboard in the screen shot below, is that I see events over an extended period of time, and a number of different AIE events. This gives me great confidence that if suspicious activity has occurred, I should be able to find it.
Note: some of these events trigger frequently and can involve similar observations. This is why a trend rule is helpful to reduce the amount of events an analyst focuses on because it identifies the first time an event is seen by the rule and does not repeat the similar event observation — in essence, it reduces the event “noise.”
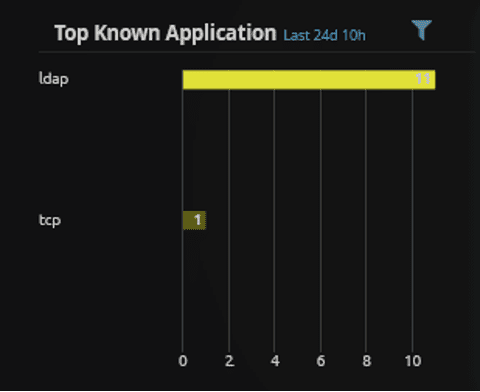
- It’s likely that each of the events displayed should be investigated further, but I’ll attempt to narrow down an event that will help determine if Log4Shell compromise has occurred. To do this, I’ll start with the “Known Application” widget and look for applications that are not identified as “LDAP.” In the screen shot below I find “TCP” being identified, so I will filter that and start there.
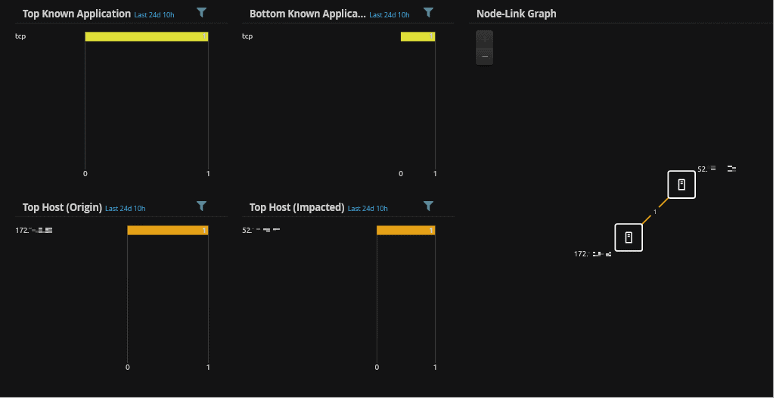
- After filtering on “TCP,” there’s one event displayed named “AIE: C2: Blacklisted Egress Port.”

And I also see an internal system reaching out to an IP address on the Internet in the screenshot below.
- I will perform an AIE drilldown on this event to further my investigation as shown in the screenshot below.
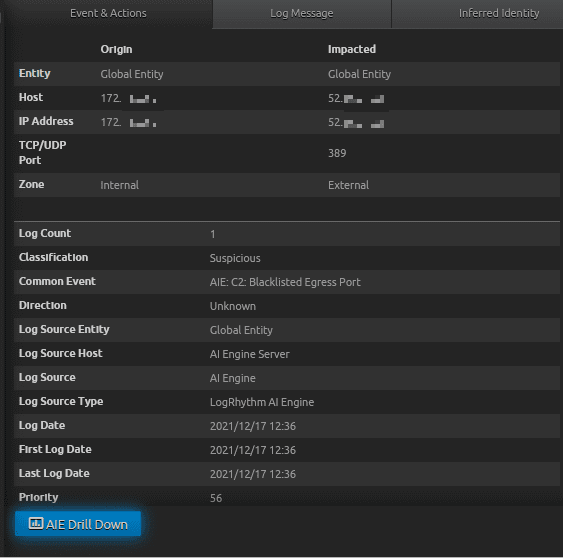
- In figure 20, the analyze pane shows two logs are returned. Both came from LogRhythm NetMon. I will now pivot over to NetMon and continue my investigation.
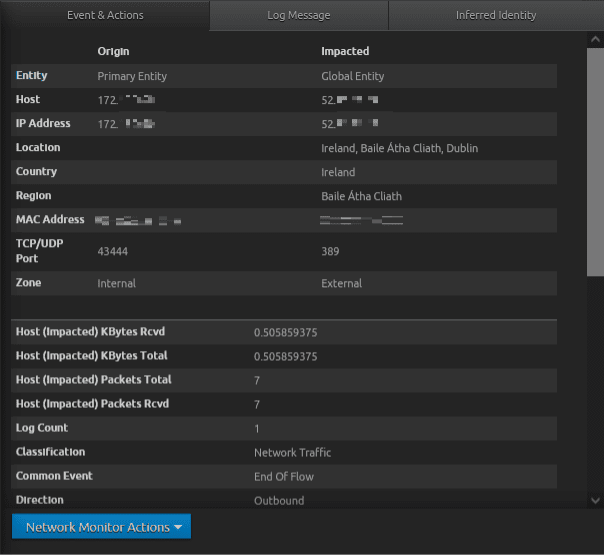
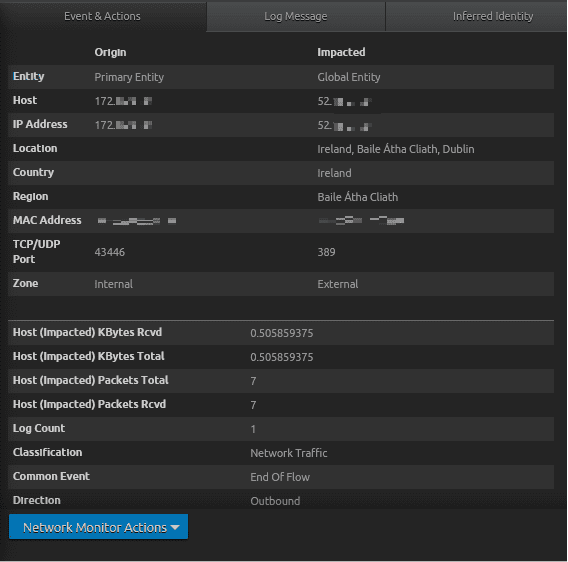
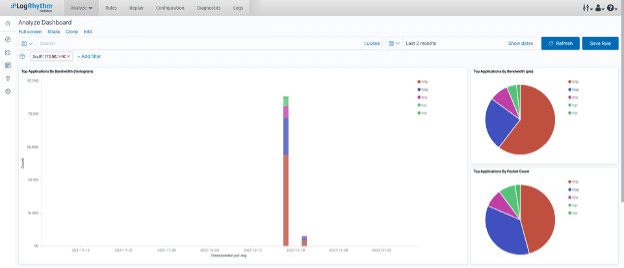
- Searching in NetMon for the IP address origin reveals quite a bit of network activity:
- As I walk through the network sessions, I can see clearly in figure 23 that this system was likely compromised with the Log4Shell attack. Right after the LDAP activity, we see HTTP activity involving Java and a GET for “Log4jRCE.class”.
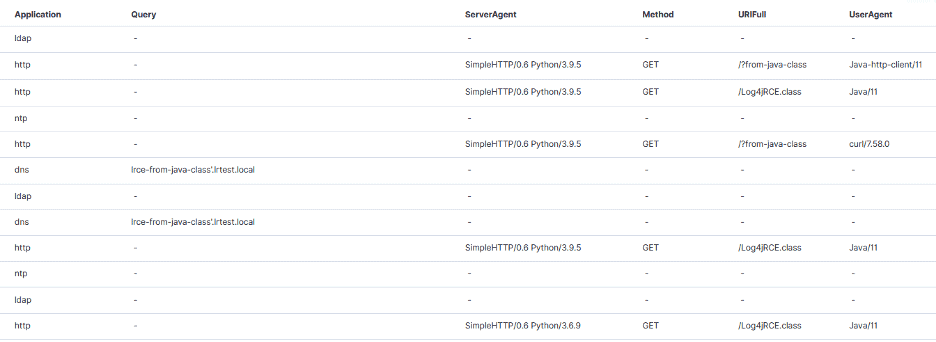
Our threat hunt is now complete and compromise due to the Log4Shell attack is likely. At this point, I would isolate the compromised system to perform forensics to determine the extent of compromise. I would also further my investigation to determine when the attack started and if any additional system or information was compromised. Detailing the investigation further is outside the scope of this blog, however.
AIE Trend Rule Details
The following is a walk-through on what the AIE trend rule use case is, and how the rule is constructed.
Rare Known Application:DNS
The trend rule is specifically looking for well-known network ports associated with DNS (port 53, and port 853), as well as applications being identified as DNS (application named DNS, or application named DNS – Domain Name System) against a 30-day baseline of observed logs. There are likely other names depending on your technology stack and logs that are identified as DNS but are named differently as they are parsed into the Application and Known Application fields in LogRhythm. Feel free to add DNS names to this list in the AIE rule.
Initially, this rule will collect matched logs, and group the following observations in the event.
- Host (Origin): Host name or IP address of the requestor
- Host (Impacted): Host name or IP address of the DNS server
- Application: Name of the application (DNS, or DNS – Domain Name System)
- Direction
The rule will trend on the following observations.
- Host (Origin)
- Host (Impacted)
- Application: Name of the application (DNS, or DNS – Domain Name System)
An example of what’s being tracked in the trend rule would be “System A” connects to “DNS Server A” for the first time. This will event. During the next evaluation time period, that similar observation will not event as it’s now in the baseline for 30 days. It’s a good idea to eventually create a list of “Allowed DNS” connections consisting of at least Host (Impacted) information, but ideally, Host (Origin) and Host (Impacted). The known host list will help in excluding known activity that may occur infrequently and greater than the 30-day baseline. But even without the list, the rule will still provide great value in your threat hunts for rogue DNS connections.
The following screen shots illustrate how the AIE trend rule is constructed.
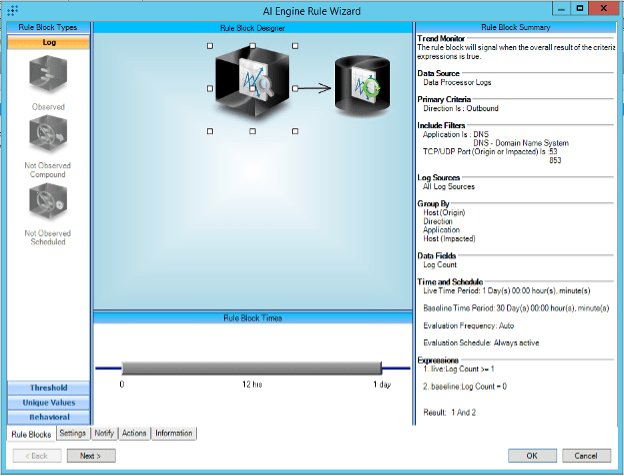
The Trend Monitor block contains the primary criteria of what logs would be considered. As previously noted, the trend rule is looking for DNS logs that also contain data in the group by fields. The evaluation time is for 1 day of live data (new logs coming in), against 30 days of baselined logs (logs that have been observed during the live time evaluation are then stored in the baseline). The AIE evaluation time is 1/3 the live time. So, this means that once every 8 hours, the live data will be compared against the baseline data, and anything “new” will event.
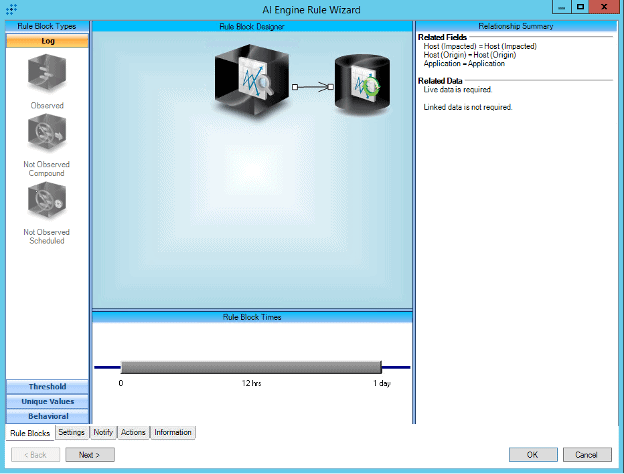
The related fields show what will be stored in the baseline.
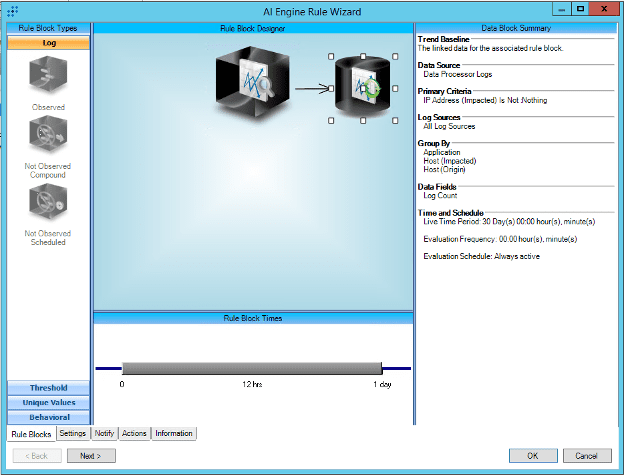
The Data Block contains the fields mapped in the Related Fields. The data kept here will age out after 30 days.
AIE rule tuning guidance:
First you should follow standard rule tuning guidance such as limiting the rule to applicable log sources. Second, feel free to change the group by settings to make this rule more applicable to your needs. For example, the rule in its current configuration is very granular, looking for Host (Origin) and Host (Impacted) combinations. Let’s say that this rule is evaluating a user network, where there’s a large number of Host (Origin) systems. You may ungroup Host (Origin) from the criteria (which also must be removed from the Related Fields, and Data Block first), which will then only event on “new” services running DNS (Host (mpacted)). This will greatly reduce the number of overall events, and only gives you insight into new DNS services, not what host was contacting the service until you perform a drill down into the event.
You may also wish to change the live time and evaluation frequency so that the rule will event in more “real time.” As mentioned earlier, bringing the time period down from one day will have performance impacts to some AIE systems. More memory is consumed related to more logs being processed that match the rule and stored in smaller time segments. Please be aware of the possible impacts to your AIE environment before implementing the rule.

In the above screenshot, you can see that in our lab (which doesn’t have the sheer log volume a production environment would have), the three-minute rule is using ~3GB of memory, whereas the “One day” rule is using ~410MB. Please use caution when changing the live time period lower than one day as the memory utilized by that rule will increase.
Rare Known Application:LDAP
This rule is almost identical to the DNS rule, but instead of looking for “DNS” traffic, it’s looking for new “LDAP” network traffic over the last 30 days. The trend rule is specifically looking for well-known network ports associated with LDAP (port 389, 636, 3268, or 3269), as well as applications being identified as LDAP (application named LDAP, LDAPS, or application named LDAP – Lightweight Directory Access) against a 30-day baseline of observed logs. There are likely other names depending on your technology stack and logs that are identified as LDAP but are named differently as they are parsed into the Application and Known Application fields in LogRhythm. Feel free to add LDAP names to this list in the AIE rule.
Initially, this rule will collect matched logs, and group the following observations in the event.
- Host (Origin): Host name or IP address of the requestor
- Host (Impacted): Host name or IP address of the DNS server
- Application: Name of the application (DNS, or DNS – Domain Name System)
- Direction
The rule will trend on the following observations.
- Host (Origin)
- Host (Impacted)
- Application: Name of the application (DNS, or DNS – Domain Name System).
An example of what’s being tracked in the trend rule would be “System A” connects to “LDAP Server A” for the first time. This will event. During the next evaluation time period, that similar observation will not event as it’s now in the baseline for 30 days. It’s a good idea to eventually create a list of “Allowed LDAP” connections consisting of at least Host (Impacted) information, but ideally, Host (Origin) and Host (Impacted). The known host list will help in excluding known activity that may occur infrequently and greater than the 30-day baseline. But even without the list, the rule will still provide great value in your threat hunts for rogue DNS connections.
The following screen shots illustrate how the AIE trend rule is constructed.
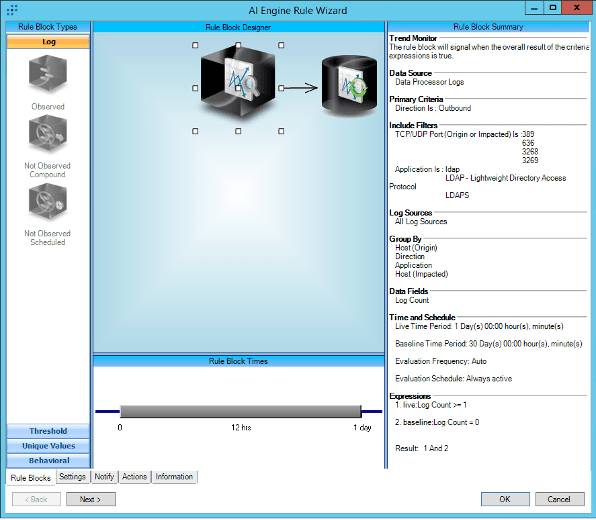
The Trend Monitor block contains the primary criteria of what logs would be considered. As previously noted, the trend rule is looking for LDAP logs that also contain data in the group by fields. The evaluation time is for one day of live data (new logs coming in), against 30 days of baselined logs (logs that have been observed during the live time evaluation are then stored in the baseline). The way AIE works in time evaluations is by default, the evaluation time is 1/3 the live time. This means that once every 8 hours, the live data will be compared against the baseline data, and anything “new” will event.
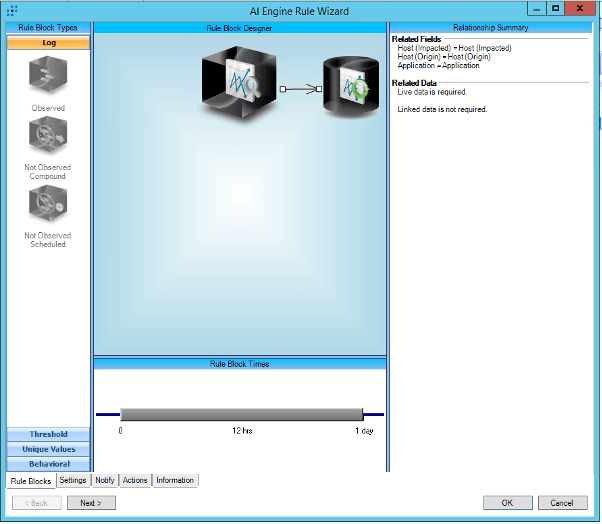
The related fields show what will be stored in the baseline.
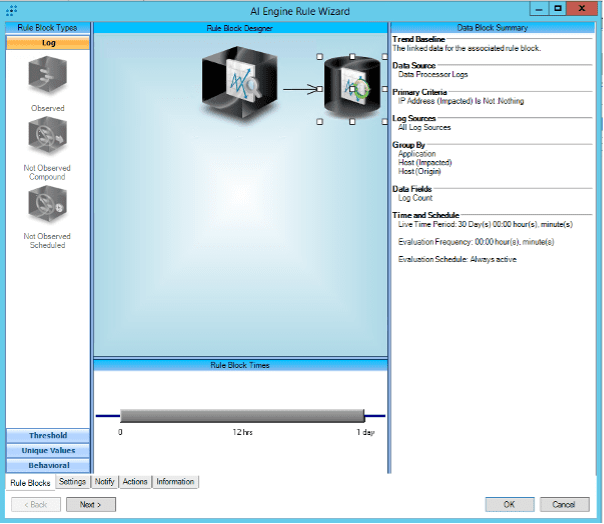
The Data Block contains the fields mapped in the Related Fields. The data kept here will age out after 30 days.
AIE Rule Tuning Guidance
First you should follow standard rule tuning guidance such as limiting the rule to applicable log sources. Second, feel free to change the group by settings to make this rule more applicable to your needs. For example, the rule in its current configuration is very granular, looking for Host (Origin) and Host (Impacted) combinations. Let’s say that this rule is evaluating primarily a user network, where there’s a large number of Host (Origin) systems. You may ungroup Host (Origin) from the criteria (which also must be removed from the Related Fields, and Data Block first), which will then only event on “new” services running LDAP (Host (Impacted)). This will greatly reduce the number of overall events, and only give you insight into new LDAP services, not what host was contacting the service until you perform a drill down into the event.
You may also wish to change the live time and evaluation frequency so that the rule will event in more “real time.” As mentioned earlier, bringing the time period down from one day will have performance impacts to some AIE systems. More memory is consumed related to more logs being processed that match the rule and stored in smaller time segments. Please be aware of the possible impacts to your AIE environment before implementing the rule.

In the above screenshot, you can see that in our lab (which doesn’t have the sheer log volume a production environment would have), the three-minute rule is using ~3GB of memory, whereas the “One day” rule is using ~410MB. Please use caution when changing the live time period lower than one-day as the memory utilized by that rule will increase.
Conclusion: Trend Rules will Help an Analyst Focus on What’s Anomalous in the Environment.
Trend rules are useful in reducing the event “noise” to only event on the first occurrence, thus making it easier for an analyst to investigate what’s “new” over time. Trend rules are helpful to event on “new,” and a trend rule use case is often thought of after knowledge of a specific attack like Log4Shell is known. Threat hunting for signs of compromise prior to a trend rule takes time, but using specific dashboards (like I did in this blog) to identify applications related to Log4Shell attacks helps narrow the search and time spent in identifying a compromise.
Happy threat hunting!

