Anatomy of a Phishing Attack
Detecting a spear phishing attack can often be like searching for a needle in haystack. However, your security operation center (SOC) analysts can use LogRhythm’s SmartResponse™ and AI Engine to rapidly detect and respond to these damaging breaches.
Read on to see LogRhythm at the center of a SOC. In this post, we’ll walk through the technical elements of the following advanced spear phishing use case.
Detecting the Anomaly
First, an analyst in your SOC is notified of an internal host communicating with a known threat list host.
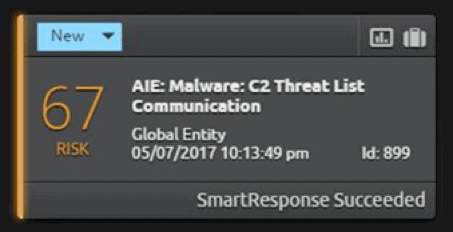
LogRhythm’s Threat Intelligence Service (TIS) integrates commercial and SOC generated threat data and is then able to correlate that data against all log sources using AI Engine. In this case, firewall log data has triggered the alarm.
Figure 2: SmartResponse Alerts and Executes Following an Internal Communication with a Known Threat List Host
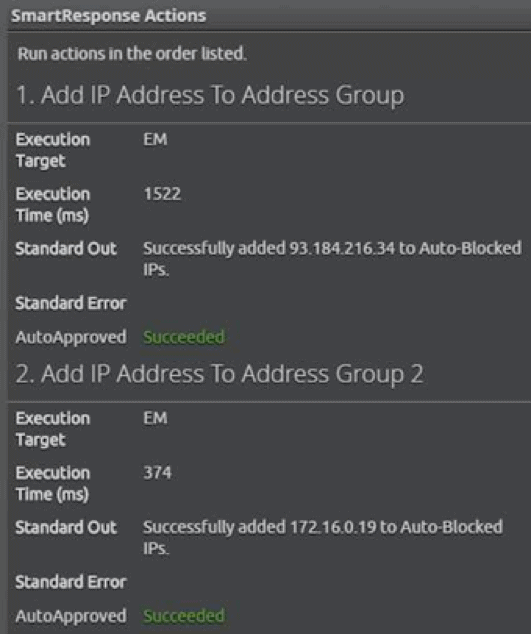
By looking at the alarm, it is apparent that a LogRhythm SmartResponse has executed. Here, you’ll see that two actions have been triggered: the blocking of all host access to the external C2 host and the blocking of all traffic from the internal host. These actions will hold until it is determined that either no malicious activity has occurred or the threat has been effectively mitigated.
Figure 3: Two SmartResponse Actions Executed
Identifying Malicious Behavior
Next, the SOC analyst can use LogRhythm’s built-in case management to begin response. This process starts by attaching case evidence and capturing the status of the SmartResponse actions.
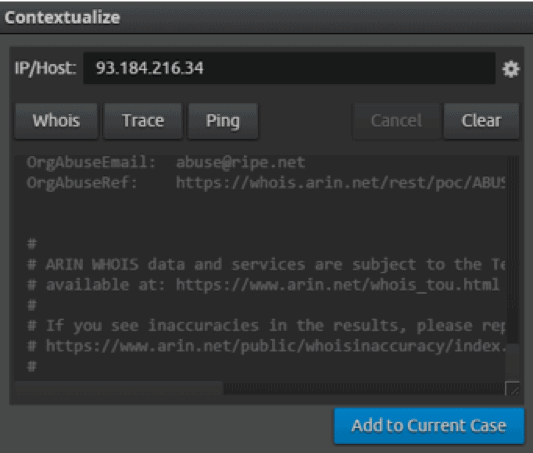
Diving deeper into the alarm details reveals the original log message that triggered the alarm, when it was held to TIS watch list. LogRhythm’s built-in contextual tools allow the SOC analyst to perform a WHOIS database lookup and ascertain the C2 registration. This lookup can provide further context into the nature of the activity and determine if it qualifies as malicious behavior.
In order to save time, your analyst can use the “Add to Case” functionality to make updating the investigation efforts a one-click operation.
Figure 4: A WHOIS Database Lookup obtains the C2 Registration
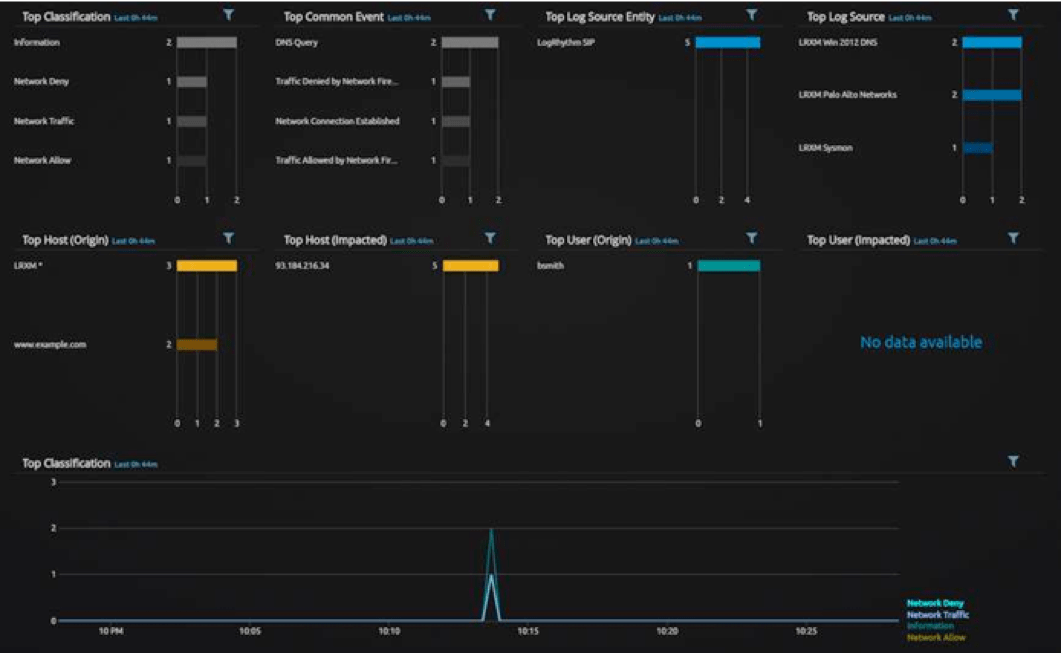
Pivoting on the C2 IP address reveals all log source activity for the timeframe around the anomalous communication. Using a “Custom Analyze” results view, all log sources that have seen activity relating to this incident become immediately apparent. These sources include the User (bsmith), the origin Host (LRXM), and the destination C2 (www.example.com). The analyst also gains visibility into the log type such as DNS Queries, Network Allow, and Denies.
Figure 5: LogRhythm Grid View Reveals a Chronological Insight into Log Activity
Determining the Source of Network Connection
LogRhythm grid view enables you to see the occurrence of a DNS query and response in chronological order. According to logs collected via our integration with Palo Alto Networks, the query was followed by a “Network Allow” response. Next, an endpoint logged by our partner, Sysmon, received a “Network Deny” response. This endpoint contains the alarm-triggering behavior.
Microsoft Sysmon is a recommended enterprise log source. It is required to provide the forensic log data needed for SOC analysts in lieu of an EDR log source. LogRhythm is able to make use of the wealth of data Sysmon provides.
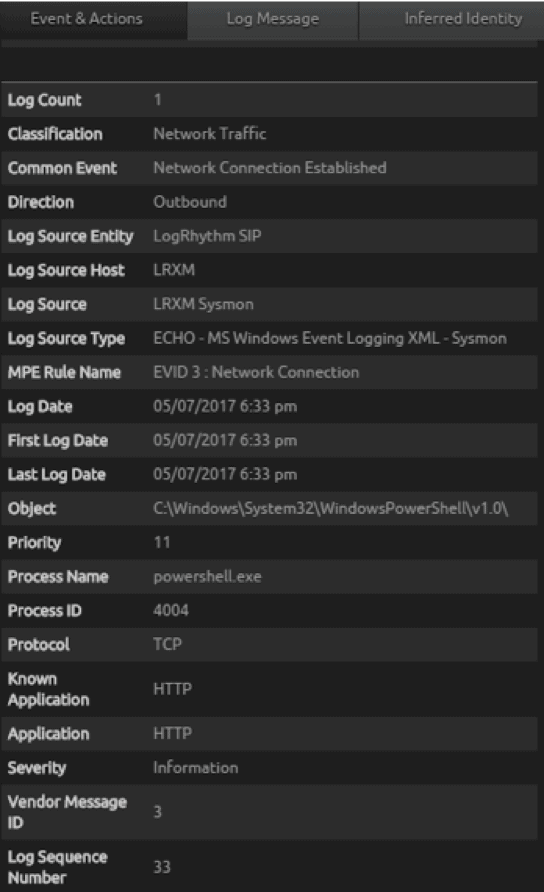
The Sysmon log source shows an “Event ID 3: Network Connection.” Upon further inspection, this log reveals Powershell.exe was the source process used to establish the network connection to the C2 host. This is not a normal behavior, so it was flagged for further investigation and added to the case.
Figure 6: Microsoft Sysmon Log Source Displaying Abnormal Behavior
Zeroing in on the Threat
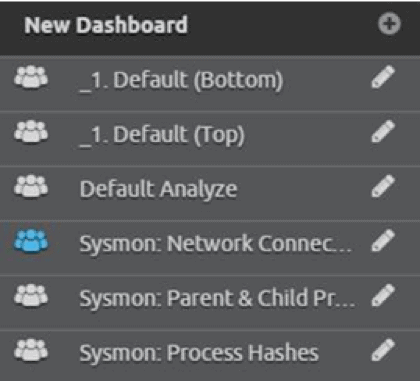
Now that the analyst has identified the Powershell.exe process as the source establishing the connection, he can clear your filters and switch to a dedicated Sysmon view. LogRhythm 7.3 features allow you to apply a set of Lucene filters globally to a dashboard or analyze view. Start with a dashboard view on all process activity. Make sure to display child and parent process activity in this dashboard.
Figure 7: Creating a New Dashboard to View All Sysmon Process Activity
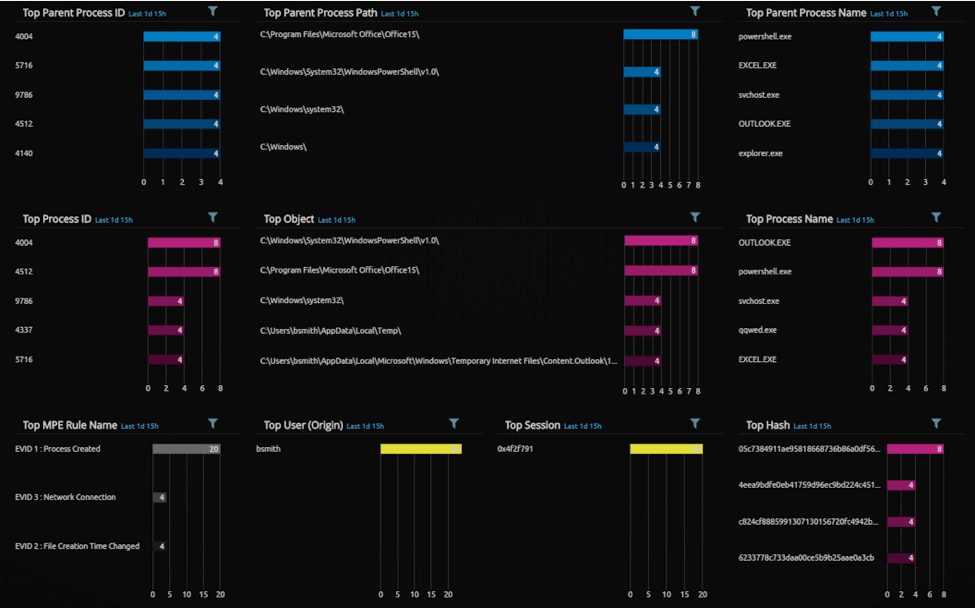
Below you can see the Sysmon parent and child process analyze layout, displaying all of the process activity from Sysmon against the host in question. With LogRhythm 7.2.X’s additional metadata filters, the analst can clearly see the child (pink) and parent processes (blue), as well as the user (bsmith) and logon session.
Figure 8: Sysmon Process Activity
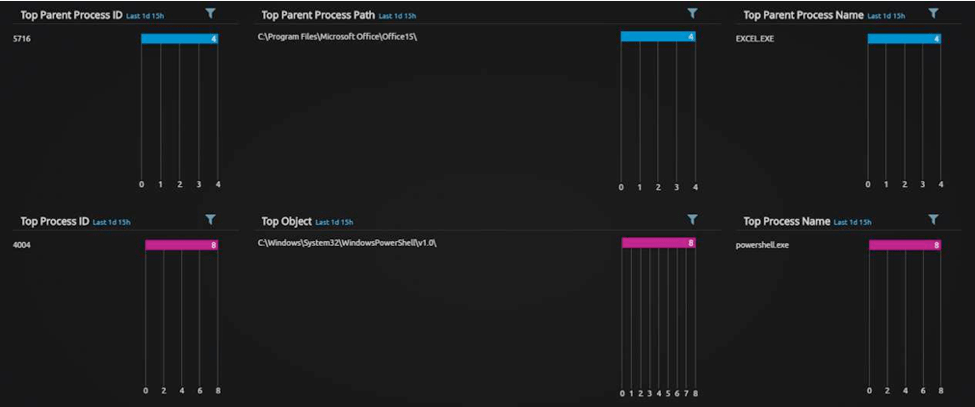
Apply a filter to find the PowerShell process.
Figure 9: Sysmon Process Activity with Filter Applied
Now the analyst can quickly and clearly see that the PowerShell process (with process ID 4004) was launched by Excel.exe, an unusual parent process.
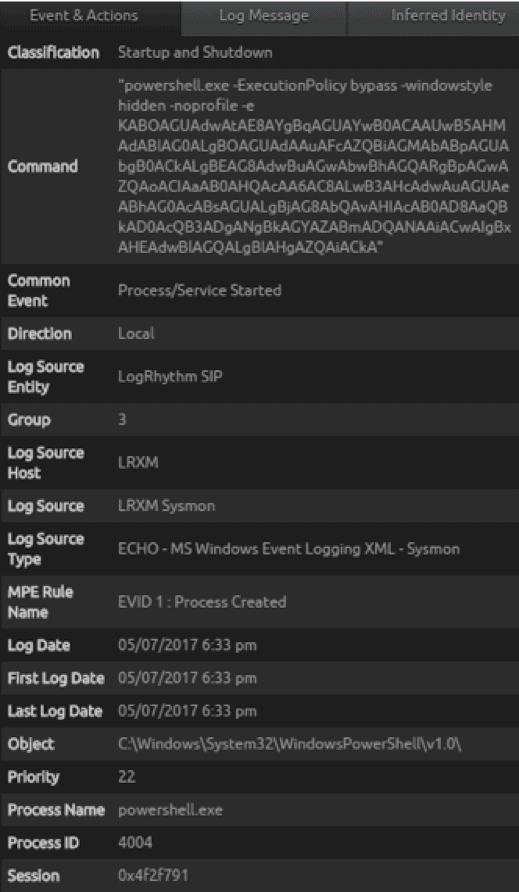
Inspecting the PowerShell metadata record reveals further interesting activity. Microsoft Sysmon captured the full command line activity of the processes and parsed it out into the command field.
Figure 10: Unusually Large PowerShell Command
The PowerShell command is an unusually large PowerShell and has obfuscated characters. This is a feature of PowerShell that enables the analyst to run encoded commands. While this feature can be used legitimately, it is also used by malware authors to hide their activities.
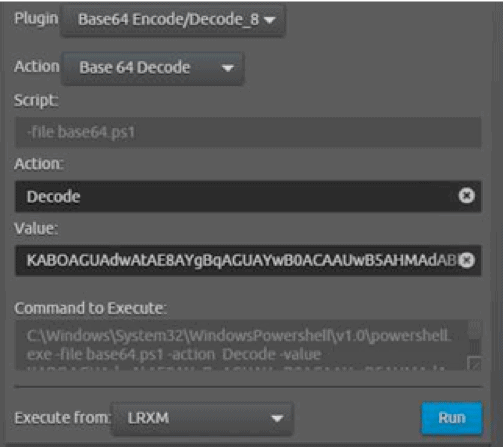
After adding this log to the case and noting the abnormal behavior, the analyst can run a LogRhythm SmartResponse that can decode the encoded command—all within one console!
Figure 11: SmartResponse Decodes an Encoded Command
This helps your SOC analysts by streamlining their workflow, as there is no need to tab out to another tool. It can also help run certain risky actions in a safer manner, and it prevent mistakes when dealing with dangerous links and code.
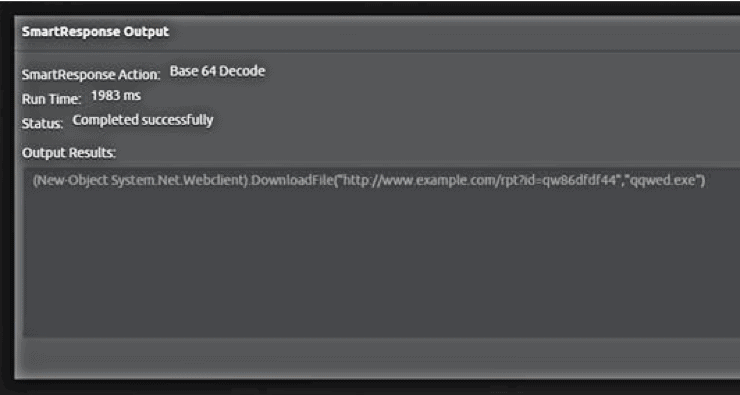
Figure 12: Output from the LogRhythm Base64 Encode/Decode SmartResponse
The resulting SmartResponse output reveals a PowerShell command that can reach out to the internet and download content. The analyst can also discover what the PowerShell process accessing the known C2 host was up to and see some additional arguments sent to the C2 and what appears to be a downloaded file. Next, the analyst can note the qqwed in the case report and begin to look around for it.
The analyst can use the integrated “Add to Case” feature to quickly add findings to the case report.
Now that the analyst knows PowerShell was launched by Excel.exe, he needs to determine if PowerShell.exe launched any other processes.
The Extent of the PowerShell.exe Breach
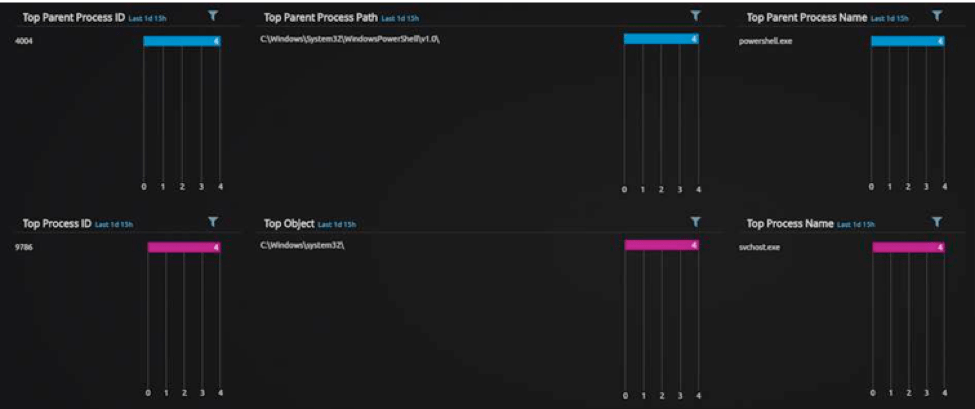
Applying PowerShell as a parent process filter reveals it did launch a svchost.exe child process. This is a legitimate Windows process, but it can be used to hide malicious activity by launching it from a known, trusted source.
Figure 13: Applying PowerShell as a Parent Process Filter
Looking at the metadata for the SVChost.exe process, the analyst can see a command line argument matches the output from the decoded PowerShell download code.
Figure 14: Command Line Argument Matches the Output from the Decoded PowerShell Download Code
It appears there was an attempt by the intruder to download a file.
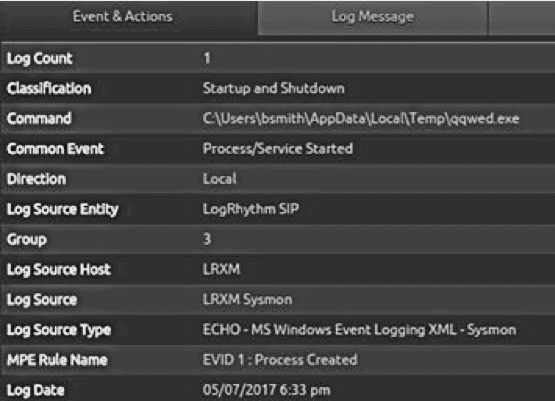
Applying the process, qqwed.exe, the analyst can see the file was successfully launched by svchost.exe. The suspected malicious file did execute!
What More Can We Find Out About This File?
At this point, the analyst should look for additional actions or activities from the malicious process, such as further network calls or child processes. However, in this case, there appears to be no further malicious action in the chain.
This could be attributed to the LogRhythm SmartResponse, which blocked communications from the source host and all access to the C2. This is a theory so far.
Figure 15: SmartResponse Command Looking Back Further into the Chain of Events Leading up to the Excel.exe Process
Earlier, the analyst discovered that Excel.exe launched PowerShell, which was strange. Can he see back any further?
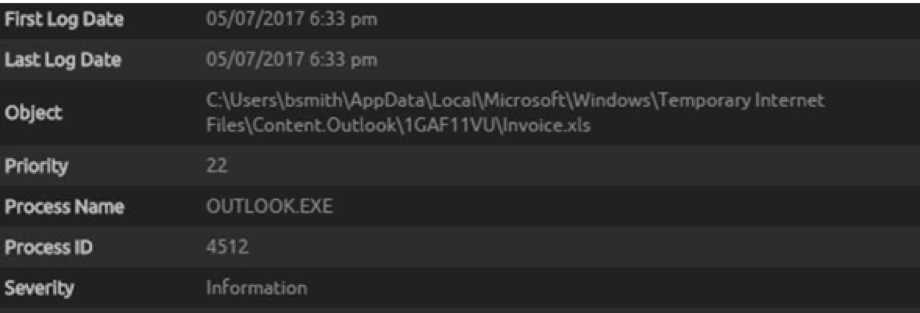
Performing the same parent and child process filter, the analyst can find that Outlook.exe launched Excel.exe. Furthermore, there’s also a temporary file being created from the same parent process ID, a file called Invoice.xls.
This is another feature of Sysmon. It can perform file system monitoring for new files and file timestamps being changed.
Figure 16: Sysmon Performs File System Monitoring for New Files and File Timestamps Being Changed
Confirming a Phishing Attack
The analyst can now can start to paint a picture from the case investigation up to this point. BSmith launched Outlook, opened a spreadsheet attachment in Excel (Invoice.xls), and that Excel.exe spawned an instance of PowerShell.exe.
Can he confirm and find that BSmith received an email with invoice.xls as an attachment?
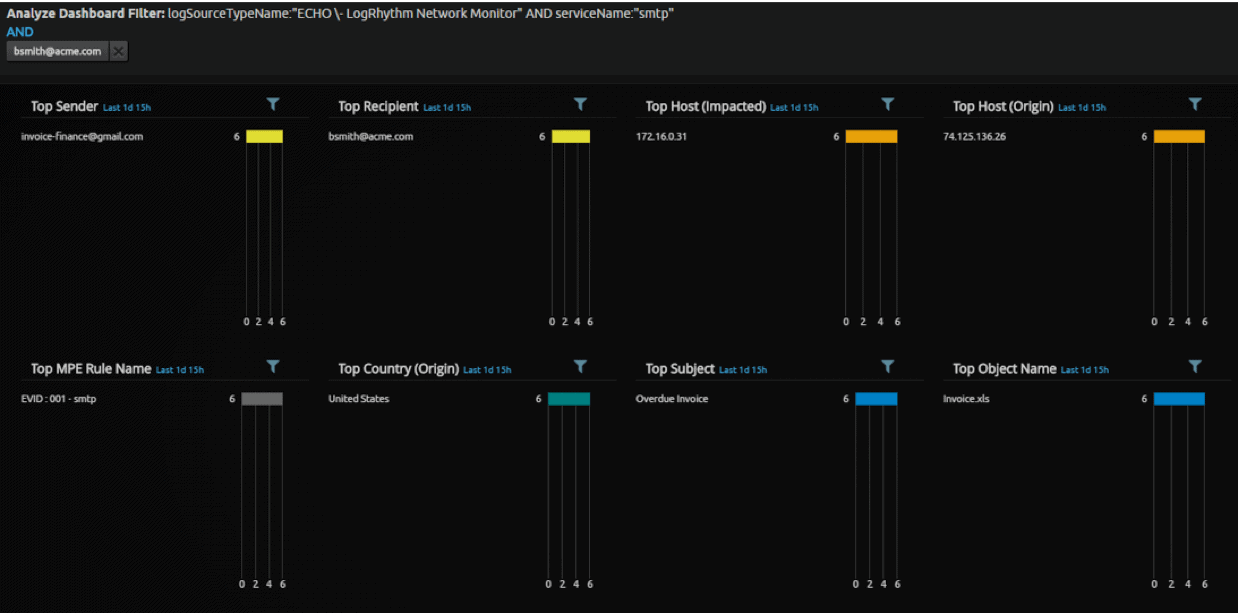
Through an advanced search, the analyst can look for the object metadata field or raw log message. He may not know the metadata field the logs are parsed out into at this stage, but can instead use elasticsearch to obtain search for “invoice.xls” and obtain rapid results.
The search results are then applied with a NetMon-specific analyze layout, which in this environment captures all email traffic going in and out of the server. The analyst will see an email with the subject of “Overdue Invoice” and an “invoice.xls” attachment. Now he has found the original email and genesis of a phishing attack.
Using NetMon to Respond
The analyst can use LogRhythm NetMon to download the PCAP or automatically extract files from the integration via WebUI. This again will help keep the analyst in one place and speed up the response and investigation process.
Figure 17: NetMon Can Be Used to Download the PCAP
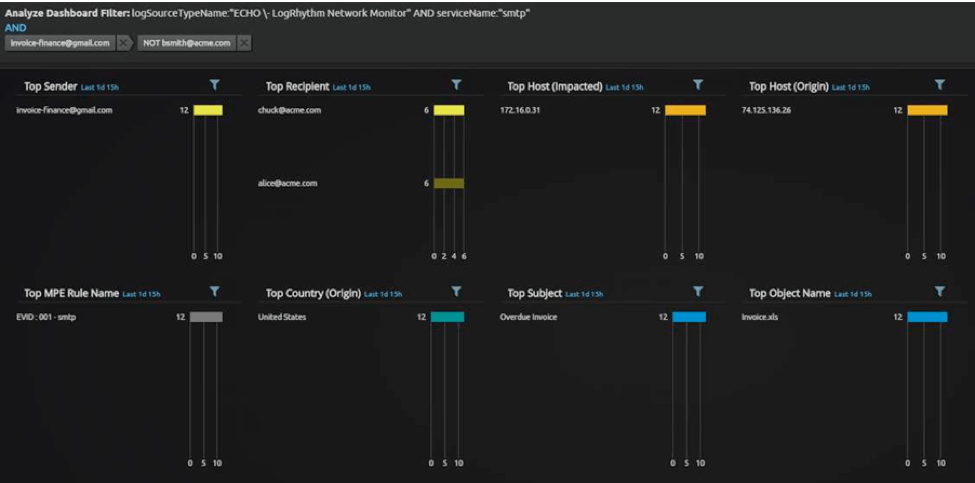
By updating the analyze layout filters, the analyst can look for all emails from the sender of the phishing email sender and see more than just those sent to Bsmith to determine if this email went out to anyone else in your organization.
The answer is yes.
Figure 18: Updating the Analyze Layout Filters to Find Additional Phishing Emails in the Network
In this example, it would be recommended to create further child process cases linked to the original. For now, however, the analyst should perform one final analysis before updating your case for triage actions.
Triage Recommendations and Response
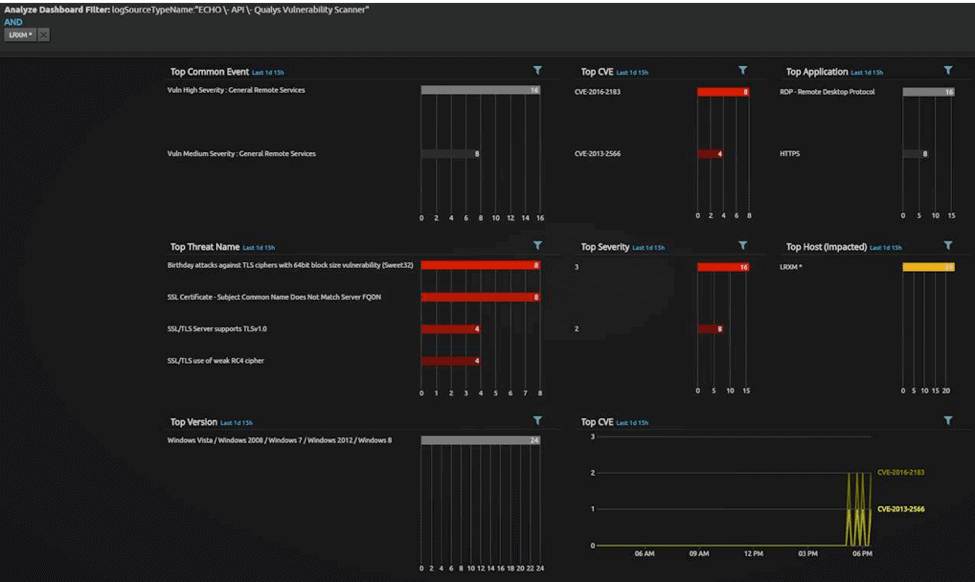
Using a custom analyze layout for Qualys, you can see the host has some suspected unpatched or unmitigated vulnerabilities. The analyst can also optionally explore the malware in question to determine if it employs either of the identified CVEs.
Figure 19: Custom Analyze Layout for Qualys
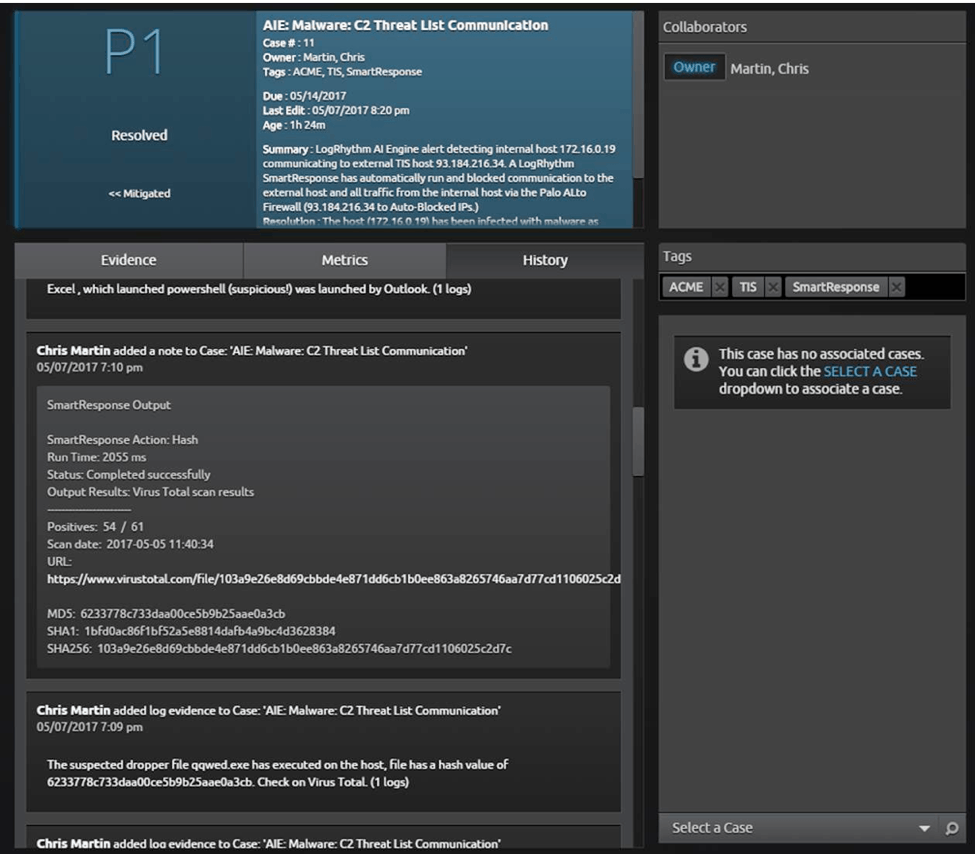
The final result is a P1 incident with triage recommendations and a full record of all evidence available to the customer.
Figure 20: P1 Incident with Triage Recommendations and a Full Record of all Evidence Available to the End Customer
Your security team now has visibility into the full extent of the breach caused by the phishing attack and can access recommended triage actions. SOC analysts are able to take their investigations from the log to the packet level in one click, effectively reducing time to detect and respond to a threat.
Spear phishing emails may be extremely difficult to detect, but providing analysts with the right tools and integrations will help you keep your network safe.
